
造纸企业经营观察
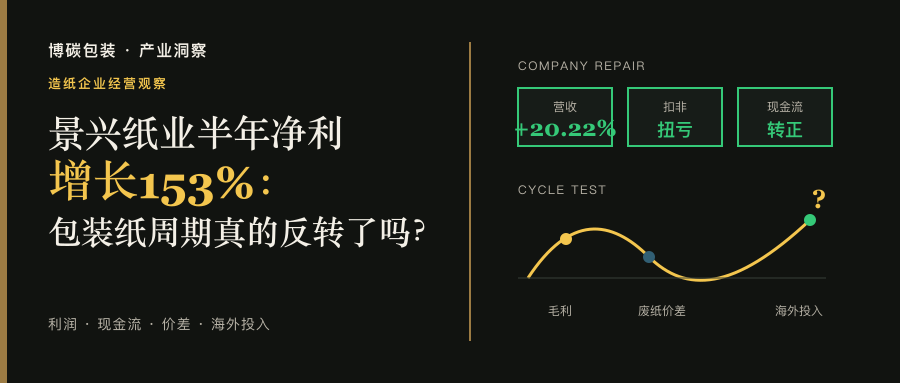
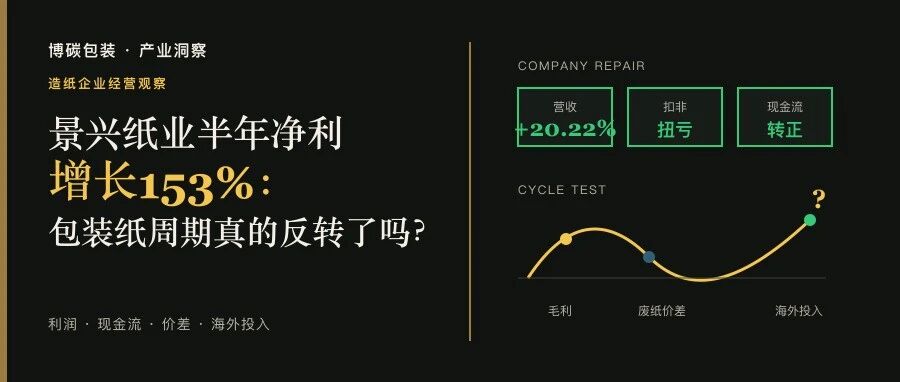
把153%还原为利润、产品价差、营运资本和海外投入,判断公司修复能否外推为行业反转。
营收增长、扣非扭亏和经营现金流转正共同证明景兴纸业修复具有实质性;但低基数、费用变化和局部业务改善,还不足以证明包装纸周期全面反转。
153%是归母净利润同比增幅,不是利润率,也不是行业增速。周期判断还要看纸价与原料价差、核心毛利率、营运资本、资本开支和海外项目。
本文以景兴纸业2026年半年度报告合并口径为主,同行和行业数据只作边界校准;不同产品结构、原料路线和资本结构不作简单排名。
2026年上半年|合并口径
31.61 亿元收入 · 1.392 亿元归母净利 · 1.271 亿元扣非净利 · 6.005 亿元经营现金流
章节01 · 数字口径
153%的分母只有5503万元
归母净利润从5503万元升至1.392亿元,绝对增加约8418万元,因此得到152.95%的同比增幅。它首先描述低基数上的恢复速度,不是利润率跃升。同期收入增长20.22%,营业成本增长21.60%,成本增速仍快于收入;整体毛利率由9.15%降至8.12%。
扣非净利润从亏损3766万元转为盈利1.271亿元,非经常性损益约1216万元,说明修复主要来自持续经营。更准确的表述是公司进入盈利修复区间,而不是利润率全面扩张。
研究资料:景兴纸业2026年半年度报告
章节02 · 产品结构
原纸和再生浆板修复,其他业务未同步
工业包装原纸收入21.83亿元,同比增长18.57%,毛利率9.50%,提高3.18个百分点。公司称需求回暖推动销量提升,但未披露销量、平均售价和废纸单位成本,因此无法把毛利改善精确拆成量、价、原料三部分。
再生浆板收入4.10亿元,同比增长431.12%,毛利率3.45%,提高8.75个百分点,由负毛利转正。高增速改善了产品组合,但3.45%的毛利率仍不高,量与价的分别贡献也没有公开。
纸箱及纸板收入基本持平、毛利率下降至5.10%;生活用纸收入下降1.70%、毛利率下降至5.53%。公司修复的中心是原纸和再生浆板,并非所有产品共同上行。
章节03 · 利润机制
整体毛利率下降,核心产品毛利率改善
整体毛利率从9.15%降至8.12%;公司同时披露,剔除上年“其他”板块1.56亿元收入、59.77%高毛利率的影响后,核心主要产品毛利率由5.96%升至8.00%,增加2.04个百分点。整体口径受收入结构影响,核心产品口径则确认业务修复,两者需要同时保留。
财务费用从3944万元降至578万元,减少约3366万元;利息费用减少约2289万元。公司称可转债摘牌后不再计息、利息收入增加。费用下降规模相当于税前利润增量的约四成,但这只是规模比较,不能称严格的利润贡献率。其他收益、公允价值变动和资产减值变化也提供了帮助。
章节04 · 现金质量
现金流转正,利润与营运资本共同作用
经营现金流从净流出4.914亿元转为净流入6.005亿元。补充资料显示,本期净利润1.426亿元,存货减少释放2.129亿元,经营性应付款增加1.251亿元,经营性应收项目占用4151万元。因此现金改善既有利润,也有库存和应付项目回流。
期末存货7.46亿元,较年末下降21.71%,对现金流帮助明显。但购建长期资产支付9.27亿元,高于经营现金流;两者相减的简化差额约-3.27亿元,说明资本投入仍需外部融资。该差额只观察资本覆盖,不是会计口径自由现金流。
现金边界:库存和应付项目带来的现金释放可能波动,后续应观察持续回款能否替代一次性营运资本改善。
章节05 · 海外投入
马来西亚项目把周期判断带到资产负债表
期末在建工程19.13亿元,较年末增加约310%,其中马来西亚二期60万吨箱板纸项目在建工程16.30亿元、工程进度90%,预计11月启动设备调试。调试、达产、稳定运行和盈利是四个阶段,后续要看开机率、良率、当地废纸成本、产品售价、物流和汇率。
公司资产负债率约33.09%,较年末约26.52%上升约6.57个百分点;长期借款从5.00亿元升至12.97亿元。景兴控股(马)上半年收入6.60亿元、净利润477万元、资产负债率64.57%。公司还拟为其1亿元借款提供最高1.1亿元保证,议案尚需股东会批准。
研究资料:景兴纸业马来西亚子公司担保公告
章节06 · 行业反方
行业利润修复,价格却未全面走强
国家统计局数据显示,上半年规模以上造纸和纸制品业收入增长5.5%,利润增长27.5%;但6月行业PPI同比下降0.1%,1—6月累计下降1.6%。利润修复与价格指数偏弱同时存在,更像成本、结构与低基数共同作用,不是全面价格繁荣。
同行也没有统一方向:太阳纸业收入与归母净利润均增长约9%,山鹰国际收入增长3.01%但仍亏损。产品结构、原料路线、海外资产和资本结构差异很大,不能简单排名;这种分化本身说明行业仍处底部修复。
研究资料:国家统计局工业企业利润;国家统计局工业生产者价格
章节07 · 兑现指标
五个指标决定反转能否成立
01|原纸价差:9.50%毛利率能否延续,取决于成品纸涨价是否持续快于废纸和能源成本。
02|再生浆板:收入放量后,3.45%毛利率能否继续提升。
03|现金来源:持续回款能否替代库存和应付变化带来的现金释放。
04|项目爬坡:马来西亚二期的开机率、良率、成本和订单是否兑现。
05|资本覆盖:经营现金流能否覆盖投入,负债率和长期借款能否趋稳。
纸上谈兵·数说本质
景兴纸业已出现阶段性走出经营低点的证据,包装纸行业仍处底部修复;只有价差、核心毛利率、持续现金流和新增产能回报同时改善,周期反转才有完整证据。
博碳包装·产业洞察·研究说明
本文基于景兴纸业、国家统计局及同行正式披露,由博碳包装独立研究整理,核验截至2026年8月27日,仅供造纸与包装产业链研究学习,不构成证券、采购或投资决策依据。博碳包装与文中企业未披露投资、供应或项目关联;如对内容、数据或权益存在异议,可提出修改、说明或删除要求,我们将在收到后24小时内核查处理。
博碳观察数据与核验来源
01|景兴纸业|2026年半年度报告
02|景兴纸业|2026年半年度业绩预告
03|景兴纸业|马来西亚子公司担保公告
04|国家统计局|2026年1—6月份规模以上工业企业利润
05|国家统计局|2026年6月份工业生产者价格
06|太阳纸业|2026年半年度报告
07|山鹰国际|2026年半年度报告
Paper Industry Operating Review
To assess whether the company’s recovery can be extrapolated into an industry-wide turnaround, the 153% figure must be unpacked into profit, product spreads, working capital and overseas investment.
Revenue growth, a swing to positive adjusted net profit and positive operating cash flow together show that Jingxing Paper’s recovery is substantive. Yet the low comparison base, changes in expenses and improvements in individual businesses are not enough to establish a full turnaround in the packaging-paper cycle.
The 153% figure is year-on-year growth in net profit attributable to shareholders—not a profit margin or an industry growth rate. A cycle assessment must also consider the spread between paper prices and raw-material costs, core gross margin, working capital, capital expenditure and overseas projects.
This article primarily uses consolidated figures from Jingxing Paper’s 2026 interim report. Peer and industry data are used only to establish analytical boundaries; companies with different product mixes, raw-material strategies and capital structures are not ranked mechanically.
First Half of 2026 | Consolidated Basis
RMB 3.161 billion in revenue · RMB 139.2 million in net profit attributable to shareholders · RMB 127.1 million in adjusted net profit · RMB 600.5 million in net operating cash flow
Section 01 · Understanding the Numbers
The 153% increase starts from a base of only RMB 55.03 million
Net profit attributable to shareholders increased from RMB 55.03 million to RMB 139.2 million, an absolute increase of approximately RMB 84.18 million and a year-on-year gain of 152.95%. The figure primarily describes the pace of recovery from a low base; it does not represent a surge in profit margin. Over the same period, revenue rose 20.22% and operating costs increased 21.60%, meaning costs still grew faster than revenue. Overall gross margin declined from 9.15% to 8.12%.
Net profit attributable to shareholders excluding non-recurring gains and losses swung from a loss of RMB 37.66 million to a profit of RMB 127.1 million. Non-recurring gains were approximately RMB 12.16 million, indicating that the recovery was driven mainly by continuing operations. More precisely, the company has entered a period of earnings recovery, rather than broad-based margin expansion.
Research source:Jingxing Paper 2026 Interim Report
Section 02 · Product Mix
Packaging Base Paper and Recycled Pulp Sheets Recovered; Other Businesses Did Not
Revenue from industrial packaging base paper was RMB 2.183 billion, up 18.57% year on year; gross margin was 9.50%, an increase of 3.18 percentage points. The company said recovering demand lifted sales volumes, but it did not disclose volumes, average selling prices or unit recovered-paper costs. The improvement in gross profit therefore cannot be precisely decomposed into volume, price and raw-material effects.
Revenue from recycled pulp sheets reached RMB 410 million, up 431.12% year on year; gross margin was 3.45%, an increase of 8.75 percentage points and a return from negative to positive territory. Rapid growth improved the product mix, but a 3.45% gross margin remains modest, and the separate contributions of volume and price were not disclosed.
Revenue from corrugated boxes and paperboard was broadly flat, while gross margin declined to 5.10%. Tissue-paper revenue fell 1.70%, with gross margin down to 5.53%. The recovery was concentrated in packaging base paper and recycled pulp sheets; not every product category improved.
Section 03 · Profit Drivers
Overall Gross Margin Fell, While Core-Product Gross Margin Improved
Overall gross margin declined from 9.15% to 8.12%. The company also disclosed that, after excluding the prior-year “other” business, which generated RMB 156 million in revenue at a 59.77% gross margin, gross margin on its core products increased from 5.96% to 8.00%, a gain of 2.04 percentage points. The consolidated measure was affected by the revenue mix, while the core-product measure confirms an operating recovery; both perspectives must be retained.
Finance costs fell from RMB 39.44 million to RMB 5.78 million, a decrease of approximately RMB 33.66 million; interest expense declined by about RMB 22.89 million. The company attributed this to the cessation of interest accrual after its convertible bonds were delisted and to higher interest income. The reduction in finance costs was equivalent to roughly 40% of the increase in profit before tax, but this is only a comparison of scale and should not be presented as a precise contribution rate. Other income, fair-value changes and movements in asset-impairment losses also provided support.
Section 04 · Cash-Flow Quality
Operating Cash Flow Turned Positive, Driven by Both Earnings and Working Capital
Net cash flow from operating activities swung from an outflow of RMB 491.4 million to an inflow of RMB 600.5 million. Supplementary disclosures show net profit of RMB 142.6 million for the period; lower inventories released RMB 212.9 million of cash, higher operating payables contributed RMB 125.1 million, and changes in operating receivables absorbed RMB 41.51 million. The improvement in cash flow therefore reflected both earnings and cash released from inventories and payables.
Period-end inventories stood at RMB 746 million, down 21.71% from year-end, providing a clear benefit to cash flow. However, cash paid to acquire and construct long-term assets reached RMB 927 million, exceeding operating cash flow. The simplified difference between the two was approximately negative RMB 327 million, indicating that capital investment still required external financing. This difference is used only to assess capital-expenditure coverage and is not a formally reported free-cash-flow measure.
Cash-flow caveat:Cash released by changes in inventories and payables may fluctuate. Future periods should show whether recurring customer collections can replace this one-off working-capital improvement.
Section 05 · Overseas Investment
The Malaysia Project Brings the Cycle Debate Onto the Balance Sheet
Construction in progress stood at RMB 1.913 billion at period end, approximately 310% higher than at year-end. Of this amount, RMB 1.630 billion related to the 600,000-tonne Phase II containerboard project in Malaysia, which was 90% complete; equipment commissioning is expected to begin in November. Commissioning, ramp-up, stable operation and profitability are four distinct stages. Future assessment must consider operating rates, yield, local recovered-paper costs, selling prices, logistics and exchange rates.
The company’s debt-to-asset ratio was approximately 33.09%, up about 6.57 percentage points from roughly 26.52% at year-end; long-term borrowings increased from RMB 500 million to RMB 1.297 billion. Jingxing Holdings (Malaysia) recorded first-half revenue of RMB 660 million, net profit of RMB 4.77 million and a debt-to-asset ratio of 64.57%. The company also proposes to provide a guarantee of up to RMB 110 million for a RMB 100 million loan to the subsidiary, subject to shareholder approval.
Research source:Jingxing Paper Announcement on a Guarantee for Its Malaysian Subsidiary
Section 06 · The Industry Counterargument
Industry Profits Are Recovering, but Prices Have Yet to Strengthen Broadly
According to the National Bureau of Statistics, first-half revenue at paper and paper-products enterprises above designated size increased 5.5%, while profit rose 27.5%. Yet the industry’s producer price index fell 0.1% year on year in June and declined 1.6% cumulatively from January through June. Recovering profits alongside a weak price index point more to the combined effects of costs, product mix and a low comparison base than to a broad pricing boom.
Peers also moved in different directions: Sun Paper’s revenue and net profit attributable to shareholders both increased by approximately 9%, while Shanying International’s revenue rose 3.01% but the company remained loss-making. Product mixes, raw-material strategies, overseas assets and capital structures vary widely, so simple rankings are inappropriate. This divergence itself indicates that the industry remains in a bottoming recovery.
Research sources:National Bureau of Statistics: Industrial Enterprise Profits; National Bureau of Statistics: Producer Prices for Industrial Products
Section 07 · Confirmation Metrics
Five Indicators That Will Determine Whether the Turnaround Is Real
01 | Packaging base-paper spread:Whether the 9.50% gross margin can be sustained depends on whether increases in finished-paper prices continue to outpace recovered-paper and energy costs.
02 | Recycled pulp sheets:Whether the 3.45% gross margin can continue to improve after the increase in revenue volume.
03 | Source of cash:Whether recurring customer collections can replace the cash released by changes in inventories and payables.
04 | Project ramp-up:Whether the Malaysia Phase II project delivers its targeted operating rate, yield, costs and orders.
05 | Capital coverage:Whether operating cash flow can cover investment and whether the debt ratio and long-term borrowings can stabilize.
Paper Industry Analysis · Let the Numbers Speak
Jingxing Paper has shown evidence of moving beyond its operating trough, while the packaging-paper industry remains in a bottoming recovery. A cycle turnaround will be fully supported only when product spreads, core gross margin, recurring cash flow and returns on new capacity improve together.
BIOTEN Packaging · Industry Insight · Research Note
This article is based on formal disclosures by Jingxing Paper, the National Bureau of Statistics and peer companies, and was independently researched and compiled by BIOTEN Packaging. Information was verified through 27 August 2026. It is provided solely for research and educational purposes within the paper and packaging value chain and does not constitute securities, procurement or investment advice. BIOTEN Packaging has no disclosed investment, supply or project relationship with the companies discussed. If any party disputes the content, data or rights involved, it may request a correction, clarification or deletion; we will review the request within 24 hours of receipt.
BIOTEN Observer Data and Verification Sources
01 | Jingxing Paper | 2026 Interim Report
02 | Jingxing Paper | 2026 Interim Earnings Forecast
03 | Jingxing Paper | Announcement on a Guarantee for Its Malaysian Subsidiary
04 | National Bureau of Statistics | Profits of Industrial Enterprises above Designated Size, January–June 2026
05 | National Bureau of Statistics | Producer Prices for Industrial Products, June 2026
06 | Sun Paper | 2026 Interim Report
07 | Shanying International | 2026 Interim Report