

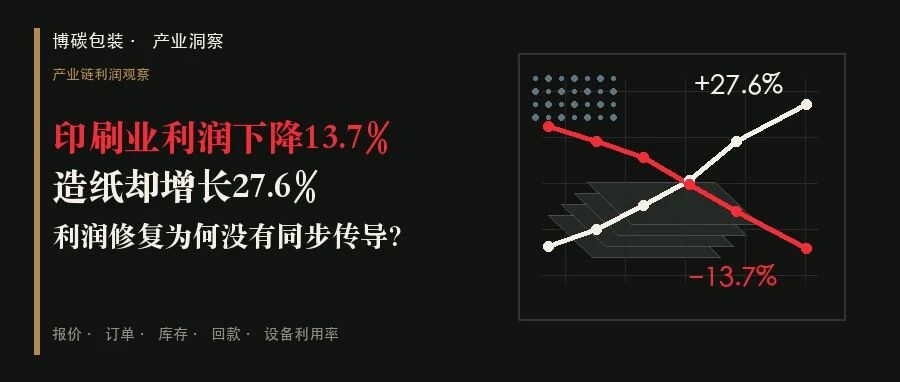
产业链利润观察
看完这篇,你可以判断自己的利润究竟卡在报价、订单、库存、回款,还是设备利用率。
利润修复没有同步传导,先别把它归因于纸厂挤压:统计分类、价格时差、订单结构和现金占用,会让同一条产业链走出不同节奏。
国家统计局的两组增速只给出方向。要找到企业自己的答案,必须把C22与C23边界、利润率、PPI和真实订单账拆开。
全国规模以上工业企业数据用于行业坐标;紫江、景兴等企业披露只作机制样本。公司口径不代表全国均价,PPI不替代具体纸种成交价。
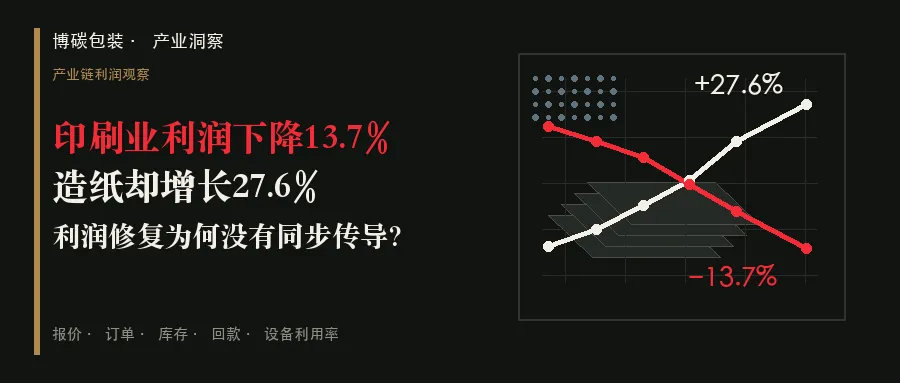
2026年1—7月|全国规模以上工业企业
−13.7% 印刷和记录媒介复制业利润 ·+27.6% 造纸和纸制品业利润
章节01 · 先校准
利润增速不等于利润率
用利润总额除以营业收入作简算,2026年1—7月造纸和纸制品业营业收入利润率约2.83%,印刷业约4.06%。印刷业利润同比下降13.7%,但当前营业收入利润率仍高出前者约1.23个百分点。
更值得看的是方向变化:2025年上半年造纸和纸制品业简算营业收入利润率约2.58%,2026年上半年升至2.84%;印刷业由约4.86%降至4.03%。造纸和纸制品业改善约0.26个百分点,印刷业收缩约0.82个百分点。
2.83%|造纸和纸制品业
2026年1—7月累计,利润总额除以营业收入,本文简算。
4.06%|印刷业
当前仍较高,但同比方向明显走弱。
4.22%|印刷业7月增量
由1—7月累计减上半年累计;受累计统计与四舍五入影响,只作增量观察,不是官方直接发布的单月利润率。
研究资料:国家统计局1—7月工业企业利润;2026年上半年数据;2025年上半年数据
章节02 · 分类与价格
行业指数不能直接替代企业报价
C22既包括纸浆和造纸,也包括纸和纸板容器制造;C23包含书刊、本册、包装装潢及其他印刷。纸箱制造与包装印刷不在同一个统计大类,27.6%与-13.7%不是整齐的上下游利润分配表。
2026年7月,造纸和纸制品业PPI环比上涨0.9%、同比上涨1.2%;印刷业环比下降0.3%、同比下降3.0%。1—7月平均,两者仍分别下降1.2%和3.1%。造纸端价格出现边际修复,印刷端仍受压。
重要边界:PPI不是白卡、灰板、箱板或瓦楞纸的具体成交价,更不是某个客户SKU的包装售价。企业必须回到同纸种、克重、地区和合同周期比较。
研究资料:国家统计局7月PPI;国民经济行业分类对照
章节03 · 企业样本
同一家企业,也有多条传导曲线
紫江企业|公司内部统计显示,2026年上半年白卡纸采购价同比下降8.2%,灰板纸采购价上涨8.4%,彩色纸包装印刷单位售价下降11.4%。数据未经审计、只代表公司口径。白卡纸采购价下降没有自动留下同等利润空间,因为彩色纸包装印刷单位售价降幅更大;灰板纸采购价又走出相反方向。
景兴纸业|公司披露原纸毛利率升至9.50%,纸箱及纸板毛利率降至5.10%;经营现金流由净流出4.914亿元转为净流入6.005亿元,其中存货减少和经营性应付项目增加提供了重要帮助。
两个样本说明:材料成本、产品售价、毛利和现金可以同时朝不同方向走。企业要找的是自己的传导断点,而不是给行业贴胜负标签。
研究资料:紫江企业主要经营数据公告;景兴纸业半年报
章节04 · 经营路径
利润从成本到现金,要经过五道门
原纸成本先进入采购,再进入报价;报价变成订单后,还要经过换线、损耗、物流和交付;收入确认后,要经过库存、应收和账期才能回到现金;设备利用率又决定固定成本由多少合格产量分摊。
下面五张卡不替企业给答案,只把问题变成可记录、可计算、可预警和可行动的字段。
章节05 · 五张经营检查卡
把利润阻点定位到具体动作
检查卡01|价格传导卡
记录什么|纸种、克重、地区、供应商、单位采购成本;对应客户、SKU、售价和调价生效日。
怎么比较|传导天数=客户新售价生效日-新材料成本生效日。仅在同一SKU、同一期间且成本与售价同方向变化时,计算传导率=销售单价变动额÷单位材料成本变动额;成本按单件实际耗用量计算。方向相反或分母为零时,直接看单位价差与毛利变化。
警惕信号|成本上升而售价不动;成本下降后,售价下降得更快。
下一步|把纸价联动、复价周期和异常波动触发点写进报价规则。
检查卡02|订单毛利卡
记录什么|材料、工序、换线时间、损耗、物流、佣金、返利和账期成本。
怎么比较|计算订单贡献毛利,再换算为每机时、每千印或每平方米贡献,避免只看销售额。
警惕信号|产量增加,每机时贡献却下降;小批量多SKU挤占高贡献订单。
下一步|调整最低起订量、换线费、急单费和低贡献订单审批权限。
检查卡03|库存与回款卡
记录什么|原料、在制品、成品库存天数,应收账龄、应付账期和经营现金流。
怎么比较|现金转换周期=库存天数+应收天数-应付天数,并与毛利和净利润方向对照。
警惕信号|利润增长,经营现金却下降;库存和逾期应收同时增加。
下一步|按周复盘老库存、客户账龄和订单归属,明确备货与逾期责任。
检查卡04|产品结构卡
记录什么|瓦楞运输包装、彩盒、食品包装、纸杯纸碗等产品的收入、售价、材料组合、良率、毛利率和退货投诉。
怎么比较|同时看单品毛利率与收入权重,计算结构变化对综合毛利率的影响。
警惕信号|高收入产品占比上升,综合毛利和现金却下降。
下一步|把客户与SKU按增长、修复、维持、退出分层,而不是用同一价格策略覆盖全部订单。
检查卡05|产能兑现卡
记录什么|可用机时、实际运行机时、合格产量、废品、单位能耗、固定成本和新增折旧。
怎么比较|开机率=运行机时÷可用机时;良率=合格产量÷投入量;单位固定成本=固定成本÷合格产量。
警惕信号|新线收入增加,但开机率低、良率不稳、单位固定成本继续上升。
下一步|为试产、爬坡、稳定运行和正现金贡献分别设置门槛,未过门不把设计产能写成经营成果。
章节06 · 压力测试
什么证据会改变当前判断?
如果印刷端PPI转正、订单与开机率改善、库存和应收下降,而利润率仍继续收缩,那么原纸及其他成本挤压的解释会增强。反过来,如果材料成本下降、售价下降更快,或订单有毛利但现金仍弱,问题就不只在上游。
纸上谈兵·数说本质
同一条产业链修复不同步,本质上是价格、订单、生产和现金没有在同一个周期内完成传导。
一个值得内部讨论的问题是:你们现在最难的一项,是成本进不了报价,订单没有贡献毛利,库存和应收占住现金,还是设备利用率不足?
博碳包装·产业洞察·研究说明
本文基于国家统计局、行业分类标准及企业正式披露,由博碳包装独立研究整理,核验截至2026年8月29日,仅供造纸、纸包装与包装印刷产业链研究学习,不构成证券、采购或投资决策依据。本文未使用未授权客户、供应、价格或项目资料;如对内容、数据或权益存在异议,可提出修改、说明或删除要求,我们将在收到后24小时内核查处理。
博碳观察数据与核验来源
01|国家统计局|2026年1—7月份全国规模以上工业企业利润
02|国家统计局|2026年上半年工业企业利润
03|国家统计局|2025年上半年工业企业利润
04|国家统计局|2026年7月份工业生产者出厂价格
05|国家统计局|国民经济行业分类对照
06|紫江企业|2026年半年度主要经营数据公告
07|景兴纸业|2026年半年度报告
VALUE-CHAIN PROFIT WATCH
This analysis helps identify whether your profit is being constrained by quotations, order economics, inventory, collections or equipment utilisation.
Profit recovery has not passed through in sync, but do not immediately attribute it to margin pressure from paper mills: statistical classifications, pricing lags, order mix and working-capital use can put different segments of the same value chain on different rhythms.
The two growth rates from the National Bureau of Statistics of China indicate direction only. To find the answer for a specific company, separate the boundaries between C22 and C23, profit margins, PPI data and actual order economics.
Data for industrial enterprises above designated size provide an industry benchmark; disclosures by companies such as Zijiang Enterprise and Jingxing Paper serve only as mechanism-level examples. Company-level figures do not represent national average prices, and PPI is not a substitute for transaction prices for specific paper grades.
January–July 2026 | Industrial Enterprises Above Designated Size Nationwide
−13.7% Profit in Printing and Reproduction of Recorded Media · +27.6% Profit in Papermaking and Paper Products
SECTION 01 · START WITH CALIBRATION
Profit Growth Is Not the Same as Profit Margin
Using total profit divided by operating revenue as a simple estimate, the January–July 2026 profit margin was approximately 2.83% for papermaking and paper products and 4.06% for printing. Printing profit fell 13.7% year on year, yet its current margin remained about 1.23 percentage points higher.
The shift is in the trend: the estimated profit margin for papermaking rose from approximately 2.58% in the first half of 2025 to 2.84% in the first half of 2026; printing fell from approximately 4.86% to 4.03%. One improved by about 0.26 percentage points while the other contracted by roughly 0.82 percentage points.
2.83% | Papermaking and Paper Products
January–July 2026 cumulative data; estimated in this article as total profit divided by operating revenue.
4.06% | Printing
Still higher at present, but clearly weaker year on year.
4.22% | Implied Incremental Printing Margin for July
Derived by subtracting first-half cumulative figures from January–July cumulative figures; owing to cumulative reporting and rounding, this is an incremental observation only, not an officially published single-month margin.
Research sources: National Bureau of Statistics of China: Industrial Enterprise Profits, January–July; first-half 2026 data; first-half 2025 data
SECTION 02 · CLASSIFICATION AND PRICING
Industry Indices Cannot Directly Replace Company Quotations
C22 includes pulp and papermaking as well as the manufacture of paper and paperboard containers; C23 includes book and periodical printing, stationery printing, packaging and decorative printing, and other printing. Corrugated-container manufacturing and packaging printing are not in the same statistical division, so +27.6% and −13.7% do not form a neat upstream–downstream profit-allocation table.
In July 2026, the PPI for papermaking and paper products rose 0.9% month on month and 1.2% year on year; the printing sector fell 0.3% month on month and 3.0% year on year. On average from January to July, the two indices were still down 1.2% and 3.1%, respectively. Prices at the papermaking end showed marginal improvement, while printing remained under pressure.
Important boundary: PPI is not the transaction price of white paperboard, greyboard, containerboard or corrugating medium, still less the selling price of a particular customer's packaging SKU. Companies must compare like-for-like paper grades, basis weights, regions and contract periods.
Research sources: National Bureau of Statistics of China: July PPI; Industrial Classification for National Economic Activities
SECTION 03 · COMPANY EXAMPLES
One Company Can Have Multiple Pass-Through Curves
Zijiang Enterprise | Internal company data show that in the first half of 2026, the purchase price of white paperboard fell 8.2% year on year, greyboard rose 8.4%, and the unit selling price of colour-printed paper packaging fell 11.4%. The figures are unaudited and represent company-specific data only. Lower white-paperboard costs did not automatically translate into an equivalent margin gain because colour-printing prices fell faster, while greyboard moved in the opposite direction.
Jingxing Paper | The company reported that gross margin on base paper rose to 9.50%, while gross margin on corrugated cases and board fell to 5.10%. Operating cash flow moved from a net outflow of RMB 491.4 million to a net inflow of RMB 600.5 million, supported substantially by lower inventories and higher operating payables.
The two examples show that material costs, product selling prices, gross margins and cash can all move in different directions at the same time. Companies need to locate their own break in the pass-through chain, not label entire sectors as winners or losers.
Research sources: Zijiang Enterprise: Announcement of Key Operating Data; Jingxing Paper: Interim Report
SECTION 04 · OPERATING PATH
Profit Must Pass Through Five Gates from Cost to Cash
Base-paper costs first enter purchasing and then quotations. Once a quotation becomes an order, it must still pass through changeovers, waste, logistics and delivery. After revenue is recognised, value must pass through inventory, receivables and payment terms before returning as cash. Equipment utilisation then determines how much qualified output absorbs the fixed-cost base.
The five cards below do not answer the questions for a company; they convert them into fields that can be recorded, calculated, monitored and acted upon.
SECTION 05 · FIVE OPERATING CHECK CARDS
Trace Profit Bottlenecks to Specific Actions
CHECK CARD 01 | PRICE PASS-THROUGH
What to record | Paper grade, basis weight, region, supplier and unit purchase cost; corresponding customer, SKU, selling price and effective date of price adjustments.
How to compare | Pass-through days = effective date of the customer's new selling price − effective date of the new material cost. Calculate the pass-through rate only for the same SKU and period, and only when cost and selling price move in the same direction: pass-through rate = change in unit selling price ÷ change in unit material cost, with cost calculated from actual material consumption per item. If the directions differ or the denominator is zero, compare the unit spread and gross-margin change directly.
Warning signals | Costs rise while selling prices remain unchanged; when costs fall, selling prices fall faster.
Next step | Build paper-price linkage, repricing cycles and triggers for abnormal volatility into quotation rules.
CHECK CARD 02 | ORDER GROSS MARGIN
What to record | Materials, process steps, changeover time, waste, logistics, commissions, rebates and the cost of payment terms.
How to compare | Calculate the contribution margin for each order, then convert it into contribution per machine hour, per thousand impressions or per square metre, rather than relying on sales revenue alone.
Warning signals | Output rises while contribution per machine hour falls; small-batch, high-SKU work crowds out higher-contribution orders.
Next step | Adjust minimum order quantities, changeover charges, rush-order fees and approval authority for low-contribution orders.
CHECK CARD 03 | INVENTORY AND COLLECTIONS
What to record | Days of raw-material, work-in-process and finished-goods inventory; receivables ageing, payable terms and operating cash flow.
How to compare | Cash conversion cycle = inventory days + days sales outstanding − days payable outstanding; compare its direction with gross margin and net profit.
Warning signals | Profit rises while operating cash flow falls; inventories and overdue receivables increase together.
Next step | Review aged inventory, customer receivables ageing and order ownership weekly, and assign responsibility for stocking and overdue balances.
CHECK CARD 04 | PRODUCT MIX
What to record | Revenue, selling price, material mix, yield, gross margin, returns and complaints for corrugated transport packaging, folding cartons, food packaging, paper cups and paper bowls.
How to compare | Track both item-level gross margins and revenue weights, and calculate how mix changes affect the consolidated gross margin.
Warning signals | The share of high-revenue products rises while consolidated gross margin and cash decline.
Next step | Segment customers and SKUs into growth, recovery, maintenance and exit tiers, rather than applying one pricing strategy to every order.
CHECK CARD 05 | CAPACITY REALIZATION
What to record | Available machine hours, operating hours, qualified output, scrap, unit energy consumption, fixed costs and incremental depreciation.
How to compare | Operating rate = operating hours ÷ available machine hours; yield = qualified output ÷ input; fixed cost per unit = fixed costs ÷ qualified output.
Warning signals | Revenue from the new line rises, but operating rate remains low, yield is unstable and fixed cost per unit continues to increase.
Next step | Set separate thresholds for trial production, ramp-up, stable operation and positive cash contribution. Do not present design capacity as operating performance until the relevant gate has been passed.
SECTION 06 · STRESS TEST
What Evidence Would Change the Current Assessment?
If printing-sector PPI turns positive, orders and operating rates improve, inventories and receivables decline, yet profit margins continue to contract, the explanation of a squeeze from base-paper and other input costs gains weight. Conversely, if material costs fall but selling prices fall faster, or orders carry gross margin but cash remains weak, the problem extends beyond the upstream sector.
ON PAPER · THE NUMBERS REVEAL THE CORE
When recovery is out of sync along the same value chain, the underlying issue is that price, orders, production and cash have not completed their pass-through within the same cycle.
One question worth discussing internally: Where is your toughest bottleneck today: costs that cannot be passed into quotations, orders that generate no contribution margin, inventory and receivables tying up cash, or insufficient equipment utilisation?
BIOTEN Packaging · Industry Insights · Research Note
This article is based on data from the National Bureau of Statistics of China, industrial classification standards and official company disclosures. It was independently researched and compiled by BIOTEN Packaging and verified through 29 August 2026. It is intended solely for research and learning across the papermaking, paper-packaging and packaging-printing value chain and does not constitute securities, procurement or investment advice. No unauthorised customer, supply, pricing or project information was used. Requests for correction, clarification or removal concerning the content, data or rights will be reviewed within 24 hours of receipt.
BIOTEN Observer Data and Verification Sources
01 | National Bureau of Statistics of China | Profits of Industrial Enterprises Above Designated Size, January–July 2026
02 | National Bureau of Statistics of China | Industrial Enterprise Profits, First Half of 2026
03 | National Bureau of Statistics of China | Industrial Enterprise Profits, First Half of 2025
04 | National Bureau of Statistics of China | Producer Prices for Industrial Products, July 2026
05 | National Bureau of Statistics of China | Industrial Classification for National Economic Activities
06 | Zijiang Enterprise | Announcement of Key Operating Data for the First Half of 2026
07 | Jingxing Paper | 2026 Interim Report