
CHINA PAPER LEADERS · NO.03
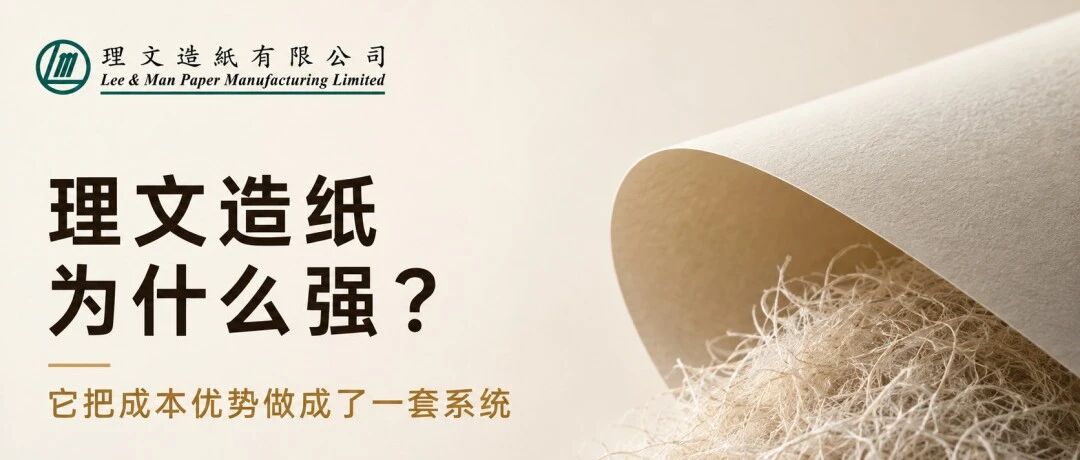
理文造纸为什么强?
它把成本优势做成了一套系统
穿透“低成本”标签,拆解一吨纸背后的原料、能源、基地、产品与资本效率
真正的成本优势,不是某一种原料买得便宜,也不是某一台纸机跑得更快,而是把合格纤维、能源蒸汽、设备效率、物流半径、产品结构和资金占用同时组织好,让每一吨合格纸的完全成本更可控、利润更可恢复、现金更可兑现。
中国造纸协会《中国造纸工业2025年度报告》公开摘要显示,2025年全国纸及纸板产量同比增长3.74%,消费量增长1.80%,供给增速继续快于需求;在重点造纸企业产量排序中,理文造纸位列第三。对于以包装纸为核心的企业,规模仍然重要,但行业真正拉开差距的地方,已经从“能不能生产”转向“在弱需求、原料波动和重资产约束下,能不能保持合理边际利润”。
2025年,理文造纸收入266.42亿港元,同比增长2.5%;年度盈利19.41亿港元,同比增长43.0%。若按普通股股东应占盈利口径,则同为约19.41亿港元,同比增长47.9%;两种增速的差异,主要来自2024年年度盈利中另有约0.45亿港元归属于永续资本证券持有人。按年报数据测算,毛利率由约11.97%升至14.62%,提高2.65个百分点;包装纸对外收入只增长0.4%,对应分部盈利却增长约65.5%。收入变化不大、利润弹性明显释放,是理解理文的第一个关键入口。
2026年7月,公司进一步发布正面盈利预告:截至2026年6月30日止六个月,预计盈利约13.3亿至13.9亿港元,较上年同期8.11亿港元增长约64%至71%,公告给出的主要原因是集团边际利润上升。公司随后通知董事会拟于8月3日审议中期业绩;截至2026年8月9日本文核验时,港交所可检索披露中尚未检得正式中期业绩公告。因此,这一信号仍应按未经审核管理账目的初步估算理解,不能替代完整业绩中的收入、销量、吨纸盈利和现金流数据。
因此,这篇文章不把“利润增长”直接等同于“所有能力都在变强”,而是追问一个更有产业价值的问题:理文怎样把原料采购、浆纸一体化、能源环保、跨区域基地、生活用纸和资本纪律,连接成一套能够共同影响吨纸成本与边际利润的系统?
FOUR NUMBERS · 四个关键数字
266.42亿港元 2025年收入 | 19.41亿港元 2025年普通股股东应占盈利 |
14.62% 2025年毛利率 | 13.3—13.9亿港元 2026年上半年预计盈利 |
口径说明:19.41亿港元采用普通股股东应占盈利口径;若按综合损益表“年度盈利”口径,同比增长43.0%。毛利率及变动值依据年报计算。2026年上半年数据来自正面盈利预告,为初步未经审核数据;截至2026年8月9日核验时,尚未检得正式中期业绩公告。
EVIDENCE LEVEL · 先分清三类证据
已实现结果:2025年收入、利润、分部表现、负债和现金流,来自经审计年报。
初步经营信号:2026年上半年盈利区间来自正面盈利预告,尚不能拆分量、价、成本与现金贡献。
规划及建设线索:PM7技改、贵港项目和未来技术部署,不计入现有产能或已实现业绩。
ONE SENTENCE · 一句话看懂理文
理文真正强的不是“某一个成本点更低”,而是让纤维、浆、能源、纸机、基地、产品和资金形成联动,把低成本从阶段性结果变成持续调节能力;这并不等于它在每个时期、每个品种都拥有行业最低绝对成本。
CORE JUDGMENT
先说结论:理文强在“系统成本能力”
理文造纸的竞争力可以拆成六个相互咬合的控制面:
完全成本化:管理每一吨合格纸,而不是只比较废纸或木浆采购价
浆纸选择权:在自制浆、外购浆和再生纤维之间动态寻找更优组合
能源基础设施:把蒸汽、电力、固废处理和碳约束纳入同一工程系统
基地网络化:以中国核心市场与东南亚基地重构供应半径和风险边界
产品组合化:以包装纸为底盘,以生活用纸和木浆改变盈利结构
资本纪律化:让技改、负债、库存和现金流共同接受回报率检验
01 · FULL COST SYSTEM
第一层:成本不是采购价格,而是一吨合格纸的总结果
包装纸企业最常见的误判,是把低成本等同于废纸便宜、煤价下降或纸机规模大。真正决定竞争力的,是原料进入工厂以后,经过分选、制浆、配浆、抄造、施胶、干燥、复卷和运输,最终形成可交付合格品时的完全成本。
成本公式
合格吨纸完全成本=合格纤维到机成本+能源与蒸汽+化学品+损耗与成品率+折旧维护+物流+库存及资金占用。
2025年,理文包装纸分部对外收入201.78亿港元,只同比增长0.4%;分部盈利却由7.66亿港元升至12.68亿港元,增长约65.5%。据此测算,包装纸分部盈利相当于对外收入的比例由约3.81%升至6.29%。这里的“分部盈利”不等于毛利或净利润;公开分部数据也不足以把改善精确拆分到售价、原料、品种结构和制造效率。但它至少说明,利润修复不能由收入规模扩张单独解释,包装纸业务的边际条件发生了明显变化。
公司披露2025年吨净利润为257港元。这个数字的意义不在于孤立比较高低,而在于观察利润对吨纸成本、售价和产品结构的敏感度:对于数百万吨级企业,单吨几十港元的持续改善,经过规模放大后就可能形成数亿港元的利润差异。
理文的成本能力不应被理解成“永远拥有最低成本”。更准确的说法是:它建立了较多可以持续调节的成本杠杆,因此在行业价格和原料条件变化时,具备更快恢复边际利润的基础。
02 · PULP OPTIONALITY
第二层:浆纸一体化的价值,不是追求最高自给率
按2025年年报列示的八个生产基地简单汇总,理文拥有约758万吨纸及纸制品年产能、95万吨木浆年产能和120万吨生活用纸年产能。设计产能不等于实际产量,但这组结构说明,理文的木浆并不是一个孤立对外销售业务,而是包装纸与生活用纸的重要原料支点。
2025年,木浆分部对外收入下降32.6%至4.47亿港元,分部间销售仍达到19.13亿港元。这意味着只看木浆对外收入,会低估其对内部供应稳定、浆料配方和产业链利润的贡献。浆厂的战略价值往往体现在内部替代和风险缓冲,而不只体现在对外卖浆。
但“有自制浆”不自动等于“浆成本最低”。自产浆仍要承担木片到厂、得率、化学品、能源、折旧、装置负荷和物流成本。专业的浆纸一体化,应当允许企业在自制浆、外购商品浆与再生纤维之间,根据价格差、纤维强度、洁净度、纸机适配和客户质量要求动态选择。
理文年报对其经营策略的表述也指向这种平衡:继续完善垂直整合,同时优化浆线设备与流程,并通过内部生产与外部采购的配合降低原料价格波动影响。其护城河不是封闭自给,而是原料路径更多、切换能力更强。
专业判断
浆纸一体化最有价值的指标,不是单独追求浆自给率,而是“合格纤维选择权”:在质量不降级的前提下,能否持续选择完全成本更优、供应风险更低的纤维组合。
03 · ENERGY INFRASTRUCTURE
第三层:能源环保不是后台成本,而是制造系统的一部分
纸机需要连续、稳定的电力和蒸汽;废纸制浆又会产生塑料杂质、浆渣和污泥。对大型包装纸企业而言,能源价格、机组效率、固废去向和环保合规不是四件分开的事情,而是一张同时影响吨纸成本与连续生产的基础设施网络。
理文2025年报披露,集团每吨纸综合能耗低于0.34吨标准煤;生产用水循环使用比例超过80%。这些数据属于公司ESG报告口径,却能够解释为什么能源管理是其成本系统的重要组成:单位消耗的持续下降,会直接影响纸机在低价竞争环境中的承受力。
更值得关注的是固废能源化。重庆理文一条1000吨/日固废焚烧线于2024年投产,年报披露其2025年发电1.16418亿千瓦时、产生高压蒸汽103.9万吨,同时减少原煤消耗4.49万吨、减少固废排放12.87万吨。这里是已经披露的年度运行结果,而不是项目规划值。
广东和马来西亚基地的废渣能源综合利用项目,则分别披露了3.5亿元、3亿元人民币投入及其设计效益。它们把废渣、废塑料、浆渣、污泥和沼气转化为蒸汽与电力,理论上可同时减少外购能源与末端处置压力;但项目经济性仍要扣除投资、折旧、运维、排放控制和原料热值波动。
理文的能源优势,不是“环保没有成本”,而是通过热电联产、固废能源化、节能改造和过程控制,把原本分散的能源采购、废物处置与合规成本,尽可能转化为可管理、可回收的系统成本。
04 · SUPPLY RADIUS
第四层:八个基地不是规模拼图,而是供应半径设计
包装纸单位价值相对有限,产品体积大、运输半径敏感,原料和成品物流会显著影响到厂成本与客户响应。理文年报列示东莞、江苏、广东、重庆、江西、越南、马来西亚和广西崇左八个基地,形成华南、华东、西南、华中与东南亚相互衔接的生产网络。
国内基地靠近中国包装消费、纸箱加工和制造业客户;重庆、江西与广西又为浆、生活用纸和区域市场提供不同支点。越南和马来西亚合计列示约195万吨纸及纸制品年产能,使理文不必只从中国工厂服务东南亚,也获得不同原料、贸易和市场环境下的第二供应半径。
2025年,理文来自中国外部客户的收入占比约84%,上年约89%,其余主要来自马来西亚和越南客户。海外收入权重上升,是区域基地开始转化为市场结构的信号;但它同样会带来跨国采购、汇率、质量一致性、产销协同和当地政策等管理复杂度。
因此,基地越多并不天然越强。网络化能力的关键,是每个基地能否获得合适原料、稳定开机、覆盖有效客户,并减少重复库存与跨区倒运。只有当市场响应与物流节约超过组织复杂度,基地网络才真正形成成本护城河。
真正的网络指标
看基地布局,不能只数工厂和产能,更要看原料到厂成本、成品配送半径、区域产销率、跨基地调拨、客户交付周期,以及每个基地的投入资本回报。
05 · PROFIT MIX
第五层:包装纸是底盘,生活用纸正在改变利润结构
2025年,包装纸贡献理文75.7%的对外收入,仍是绝对核心;生活用纸收入60.17亿港元,同比增长15.1%,占对外收入22.6%;木浆对外收入占比约1.7%。从收入结构看,理文仍是一家以箱板纸、瓦楞芯纸等包装原纸为底盘的企业。
但利润结构已经不完全相同。生活用纸分部盈利10.63亿港元,同比增长12.9%,按三个分部盈利合计测算,占比约43.7%;包装纸约占52.2%。生活用纸以不到四分之一的收入,贡献超过四成的分部盈利,说明它已经不是边缘副业,而是理文利润组合的重要支柱。
生活用纸的需求节奏、品牌渠道和价格形成机制与工业包装纸不同,可以降低单一包装纸周期的暴露;包装纸又为规模制造、客户网络和现金周转提供底盘;木浆承担内部纤维供应。三者共同构成“工业品规模+消费品价值+上游原料”的组合。
不过,组合并不等于自动对冲。2025年生活用纸分部盈利增速低于收入增速,据年报数据测算,其分部盈利相当于对外收入的比例由约18.01%小幅降至17.66%。消费品业务还要承担品牌、渠道、促销、成品库存和品质稳定等要求,不能只用产能扩张解释长期竞争力。
理文的产品结构优势,不是“业务越多越安全”,而是不同业务能否共享浆、能源、制造和供应链能力,同时保持各自的客户价值与资本回报。
06 · CAPITAL DISCIPLINE
第六层:技改与资本纪律,要让每一吨创造更高回报
2026年公开备案和环境评价信息显示,广东理文拟投资7.2亿元对PM7生产线进行原地技术改造,备案公示的计划建设周期为2026年6月至2027年6月。据环评报批稿公开信息的行业摘要,改造前后产能维持30万吨/年,产品克重拟由120—250克/平方米调整至60—160克/平方米,并升级纸机幅宽、工作车速、制浆筛选、流浆箱和膜转移施胶等系统。上述内容属于项目方案,不是已实现技改效果。
这类项目最值得研究的地方,是“产能不变”。它不是通过新增名义吨数获取增长,而是尝试以低克重、高品质、效率和能耗改善,提高每一吨纸的产品适配与资产产出。若客户可以在满足抗压、耐破、环压和加工要求的前提下降低包装用纸克重,价值就可能从“吨价”转向“单箱材料成本与性能”。
资本端也出现修复。2025年理文包含资本化金额的总财务成本由9.35亿港元降至7.36亿港元,银行借款由219.82亿港元降至210.06亿港元,净负债比率(年报口径)由0.73降至0.63;经营活动现金净额由4.26亿港元升至35.20亿港元。
但现金流改善不能只看一个总数。2025年营运资金变动前经营现金流为26.73亿港元,同比增长约24.8%;最终经营现金流还受到现金流量表所列存货减少9.52亿港元、应收及预付款减少1.62亿港元、应付账款增加6.74亿港元推动。回款端有所改善,应收账款周转天数由47天缩短至41天。
需要特别区分:现金流量表列示的“存货减少9.52亿港元”,不能直接理解为期末库存余额下降;资产负债表中的存货余额实际上由44.19亿港元升至48.22亿港元。公开报表没有完整拆解两种口径之间的桥接因素。与此同时,原料和成品库存周转天数分别由54天、14天升至60天、18天,应付账款周转天数由43天延长至61天,说明部分现金流改善伴随库存周转变慢与供应商账期延长。
这组数据给出一个更完整的判断:
理文的盈利、负债和现金状况在改善,但原料与成品库存效率、供应商账期和技改回报仍需持续观察。真正的资本纪律,是利润率、库存、应付、负债和自由现金流同步改善,而不是依赖其中一个指标。
2026 CHANGE SIGNALS
六条最新线索,正在重写理文的成本边界
2026年3月|利润修复获得年报确认
2025年收入增长2.5%;普通股股东应占盈利增长47.9%(年度盈利口径增长43.0%)。包装纸分部在收入基本持平的情况下显著修复盈利,至少说明经营改善不能由规模扩张单独解释;各因素贡献仍需结合更细的量价成本数据判断。
2026年3月至7月|PM7从“更多吨”转向“更好吨”
7.2亿元技改保持30万吨年产能不变,拟转向更低克重的高档牛皮箱板纸,并同步升级制浆、抄纸和自动控制系统。当前属于备案及公开环境评价阶段,不能提前写成已建成结果。
2026年经营方向|自动化与人工智能进入制造流程
公司在年报中提出积极部署自动化、人工智能及其他技术应用,以优化生产流程和工作流,并推进电站技术升级。它说明智能制造已被纳入降本框架,但尚需等待节拍、能耗、质量与人员效率等量化成果。
2026年5月至6月|贵港项目进入设备安装
贵港地方公开信息显示,“贵港理文纸业项目”规划总投资275亿元:一期规划投资100亿元,建设100万吨漂白化学浆及80万吨高档生活用纸和制品;二期规划投资175亿元,布局生物基可降解高端新材料。一期于5月开始设备安装,预计2027年年中投产。该项目不在理文造纸2025年报列示的八个生产基地内,本文不将规划产能计入上市公司现有产能;其投资、资产和收益如何纳入上市公司合并口径,仍需正式披露确认。
2026年7月|上半年边际利润继续抬升
正面盈利预告预计上半年盈利同比增长64%至71%,公司明确给出的原因是边际利润上升。公司通知董事会拟于8月3日审议中期业绩;截至8月9日本文核验时,尚未检得正式业绩公告。后续需验证改善来自售价、原料、产品结构、产量、费用还是多因素叠加。
2026—2028年|海外销售接口继续制度化
持续关连交易公告设定2026—2028年包装纸协议年度上限,分别为2.798亿、5.423亿和5.694亿港元。交易按个别订单开展,双方均不承担独家交易义务;年度上限不是锁定订单、销售承诺或收入预测。其价值在于为海外销售提供制度化接口,并利用马来西亚与越南基地的成本和区位条件,而不是提前确认收入。
CONCLUSION
成本优化是目的,
系统控制才是能力
理文造纸真正强的,不是拥有一个永远不变的最低成本,而是把成本拆成多个可以管理的变量:纤维怎么选、浆从哪里来、能源如何循环、基地覆盖多远、产品怎样组合、纸机如何技改、资金怎样周转。
当这些变量互相协同时,收入小幅变化也可能释放更大的利润弹性;当其中一环失衡,浆厂负荷、能源装置、海外基地、生活用纸渠道和库存资金又会同时放大复杂度。这也是“系统优势”与“重资产风险”共存的真实边界。
接下来判断理文能否继续变强,应重点看五件事:
2026年中期盈利预告能否落实为销量、吨纸利润与经营现金流的同步改善?
PM7技改能否实现低克重产品的质量稳定、客户认证和能耗目标?
生活用纸能否维持较高利润贡献,同时避免渠道费用和库存侵蚀?
海外基地和贵港相关项目能否形成清晰的市场、资本与合并口径回报?
负债下降的同时,原料库存、成品库存和供应商账期能否共同回归更优水平?
理文最深的竞争力,是把“便宜”变成一套工程,把成本变成可控变量,再把可控成本转化为利润韧性和市场选择权。
NEXT ISSUE · 系列预告
下一篇:山鹰国际为什么强?它真正运营的是一张循环网络
“中国纸业强企样本研究”不做简单企业介绍,持续拆解头部纸企的资源、成本、产品、管理与产业链能力。
博碳包装·产业洞察·研究说明
中国造纸协会《中国造纸工业2025年度报告》:行业运行及重点企业信息
理文造纸《2025年年度报告》:港交所披露原文
理文造纸2026年中期正面盈利预告:港交所披露原文
理文造纸2026年中期业绩董事会会议通知:港交所披露原文
理文造纸基地与产能布局:企业官网
广东理文PM7生产线技改备案:广东省投资项目在线审批监管平台信息摘要
广东理文PM7环境影响报告书公众参与公示:东莞市环境保护产业协会公示原页技术信息摘要
贵港理文纸业项目建设进展:贵港日报·贵港新闻网
2026—2028年包装纸协议:港交所披露原文
本文为产业研究与一般性信息,不构成投资、商业或法律意见。本文对企业战略、竞争力和产业机会的分析包含基于公开资料的专业判断,不代表企业官方表述,也不意味着任何合作或产品采用关系。2025年数据来自经审计年报;2026年中期盈利预告为初步未经审核数据;设计产能、规划投资、备案、环境评价、设备安装和预计投产时间,不等于实际产量、有效产能、建成投产或商业回报。贵港项目为地方公开项目进展,不在理文造纸2025年报列示的八个生产基地内,现有公开资料不足以确认其全部投资、资产和收益如何纳入香港上市公司合并口径。企业应结合正式公告、项目批复、实际投产和具体应用要求进行核验。信息核验截至2026年8月9日。
CHINA PAPER LEADERS · NO.03
Why Is Lee & Man Paper Strong?
It Has Turned Cost Advantage into a System
Looking Beyond the “Low-Cost” Label to Examine the Raw Materials, Energy, Production Bases, Product Mix, and Capital Efficiency Behind Every Metric Ton of Paper
A genuine cost advantage does not come from buying one raw material cheaply or running one paper machine faster. It comes from organizing qualified fiber, energy and steam, equipment efficiency, logistics radius, product mix, and working capital simultaneously—making the full cost of every metric ton of qualified paper more controllable, margins more recoverable, and earnings more readily convertible into cash.
A public summary of the China Paper Association’s 2025 Annual Report on China’s Paper Industry shows that national paper and paperboard output increased 3.74% year over year in 2025, while consumption rose 1.80%, meaning supply continued to grow faster than demand. Lee & Man Paper ranked third among key papermaking enterprises by output. For a company centered on packaging paper, scale remains important, but the real basis of industry differentiation has shifted from “whether it can produce” to “whether it can preserve reasonable marginal profitability under weak demand, raw-material volatility, and heavy-asset constraints.”
In 2025, Lee & Man Paper recorded revenue of HK$26.642 billion, up 2.5% year over year, and profit for the year of HK$1.941 billion, up 43.0%. Profit attributable to ordinary shareholders was also approximately HK$1.941 billion, up 47.9%; the difference between the two growth rates mainly reflects approximately HK$45 million of 2024 profit attributable to holders of perpetual capital securities. Based on annual-report data, gross margin increased from approximately 11.97% to 14.62%, an improvement of 2.65 percentage points. External revenue from packaging paper grew only 0.4%, while corresponding segment profit increased approximately 65.5%. The combination of modest revenue growth and a pronounced release of profit elasticity is the first key to understanding Lee & Man Paper.
In July 2026, the company issued a positive profit alert: for the six months ended June 30, 2026, it expected profit of approximately HK$1.33 billion to HK$1.39 billion, representing growth of approximately 64% to 71% from HK$811 million in the prior-year period. The announcement attributed the increase primarily to higher marginal profit for the Group. The company subsequently announced that its board would meet on August 3 to consider the interim results; as of this article’s verification date of August 9, 2026, no formal interim-results announcement had been found in searchable HKEX disclosures. This signal should therefore still be treated as a preliminary estimate based on unaudited management accounts and cannot substitute for full data on revenue, sales volume, profit per metric ton of paper, and cash flow.
This article therefore does not equate “profit growth” directly with “every capability becoming stronger.” Instead, it asks a more industrially relevant question: how does Lee & Man Paper connect raw-material procurement, pulp-and-paper integration, energy and environmental infrastructure, cross-regional production bases, tissue paper, and capital discipline into a system that jointly influences cost per metric ton and marginal profit?
FOUR NUMBERS · Four Key Figures
HK$26.642 Billion 2025 Revenue | HK$1.941 Billion 2025 Profit Attributable to Ordinary Shareholders |
14.62% 2025 Gross Margin | HK$1.33–1.39 Billion Estimated Profit for the First Half of 2026 |
Scope note: HK$1.941 billion is stated on the basis of profit attributable to ordinary shareholders; on the consolidated income statement’s “profit for the year” basis, the year-over-year increase was 43.0%. Gross margin and its change are calculated from annual-report data. First-half 2026 data are from a positive profit alert and are preliminary and unaudited; as of the verification date of August 9, 2026, no formal interim-results announcement had been found.
EVIDENCE LEVEL · Three Types of Evidence
Results Achieved: 2025 revenue, profit, segment performance, debt, and cash flow are drawn from the audited annual report.
Preliminary Operating Signal: The first-half 2026 profit range comes from a positive profit alert and cannot yet be broken down into volume, price, cost, and cash contributions.
Planning and Construction Indicators: The PM7 technical upgrade, the Guigang project, and future technology deployment are not counted as existing capacity or realized performance.
ONE SENTENCE · Lee & Man Paper in One Sentence
Lee & Man Paper’s real strength is not that “one cost item is lower,” but that it links fiber, pulp, energy, paper machines, production bases, products, and capital—turning low cost from a temporary outcome into an ability to adjust continuously. This does not mean it has the industry’s lowest absolute cost in every period or for every product grade.
CORE JUDGMENT
Bottom Line First: Lee & Man Paper’s Strength Lies in Its “System-Level Cost Capability”
Lee & Man Paper’s competitiveness can be divided into six interlocking control dimensions:
Full-Cost Management: Managing every metric ton of qualified paper rather than comparing only recovered-paper or wood-pulp purchase prices
Pulp-and-Paper Optionality: Dynamically seeking a better mix among captive pulp, market pulp, and recovered fiber
Energy Infrastructure: Integrating steam, electricity, solid-waste treatment, and carbon constraints into one engineering system
Networked Production Bases: Reshaping supply radii and risk boundaries through core Chinese markets and Southeast Asian production bases
Product Portfolio: Using packaging paper as the operating foundation while tissue paper and wood pulp reshape the profit mix
Capital Discipline: Subjecting technical upgrades, debt, inventory, and cash flow to a common return-on-investment test
01 · FULL COST SYSTEM
Layer One: Cost Is Not the Purchase Price, but the Total Outcome of One Metric Ton of Qualified Paper
The most common mistake made by packaging-paper producers is to equate low cost with cheap recovered paper, lower coal prices, or large paper machines. True competitiveness is determined by the full cost of converting incoming raw materials—through sorting, pulping, stock preparation, papermaking, sizing, drying, rewinding, and transportation—into qualified products ready for delivery.
Cost Formula
Full Cost per Metric Ton of Qualified Paper = Delivered Cost of Qualified Fiber + Energy and Steam + Chemicals + Process Losses and Yield + Depreciation and Maintenance + Logistics + Inventory and Working-Capital Costs.
In 2025, the packaging-paper segment generated external revenue of HK$20.178 billion, up only 0.4% year over year, while segment profit increased from HK$766 million to HK$1.268 billion, a rise of approximately 65.5%. On this basis, segment profit as a percentage of external packaging-paper revenue increased from approximately 3.81% to 6.29%. “Segment profit” is not equivalent to gross profit or net profit, and publicly disclosed segment data are insufficient to attribute the improvement precisely among selling prices, raw materials, product mix, and manufacturing efficiency. At a minimum, however, the figures show that the profit recovery cannot be explained by revenue expansion alone and that marginal conditions in the packaging-paper business changed materially.
The company disclosed net profit per metric ton of HK$257 for 2025. The value of this figure lies not in an isolated high-or-low comparison, but in showing the sensitivity of profit to cost per metric ton, selling prices, and product mix: for a company producing several million metric tons, a sustained improvement of several tens of HK dollars per metric ton can translate into profit on the scale of hundreds of millions of HK dollars.
Lee & Man Paper’s cost capability should not be interpreted as “always having the lowest cost.” A more accurate description is that it has established multiple continuously adjustable cost levers, giving it a basis for restoring marginal profitability more quickly when industry prices and raw-material conditions change.
02 · PULP OPTIONALITY
Layer Two: The Value of Pulp-and-Paper Integration Is Not Maximizing Self-Sufficiency
A simple aggregation of the eight production bases listed in the 2025 annual report indicates annual capacity of approximately 7.58 million metric tons of paper and paper products, 950,000 metric tons of wood pulp, and 1.2 million metric tons of tissue paper. Designed capacity is not actual output, but this structure shows that Lee & Man Paper’s wood-pulp operations are not an isolated external-sales business; they are an important raw-material platform for packaging paper and tissue paper.
In 2025, external revenue from the wood-pulp segment declined 32.6% to HK$447 million, while intersegment sales still reached HK$1.913 billion. Looking only at external wood-pulp revenue therefore understates its contribution to internal supply stability, pulp furnish design, and industrial-chain profitability. A pulp mill’s strategic value often lies in internal substitution and risk buffering, not merely in external pulp sales.
But “having captive pulp” does not automatically mean “having the lowest pulp cost.” Captive pulp still bears delivered wood-chip costs, yield, chemicals, energy, depreciation, operating-rate, and logistics costs. Professional pulp-and-paper integration should enable dynamic choices among captive pulp, purchased market pulp, and recovered fiber based on price differentials, fiber strength, cleanliness, paper-machine compatibility, and customer quality requirements.
Lee & Man Paper’s annual report describes a strategy consistent with this balance: continuing to enhance vertical integration while optimizing pulp-line equipment and processes, and reducing exposure to raw-material price volatility through a combination of internal production and external procurement. Its moat is not closed-loop self-sufficiency, but a broader set of raw-material pathways and stronger switching capability.
Professional Judgment
The most valuable measure of pulp-and-paper integration is not the pulp self-sufficiency ratio alone, but “qualified-fiber optionality”: whether the company can continuously select a fiber mix with a lower full cost and lower supply risk without compromising quality.
03 · ENERGY INFRASTRUCTURE
Layer Three: Energy and Environmental Management Are Part of the Manufacturing System, Not Back-Office Costs
Paper machines require continuous, stable supplies of electricity and steam, while recovered-paper pulping generates plastic contaminants, pulp rejects, and sludge. For a large packaging-paper producer, energy prices, generating-unit efficiency, solid-waste disposal pathways, and environmental compliance are not four separate matters; together, they form an infrastructure network that affects both cost per metric ton and production continuity.
Lee & Man Paper’s 2025 annual report states that the Group’s comprehensive energy consumption was below 0.34 metric tons of standard coal equivalent per metric ton of paper and that more than 80% of production water was recycled. These figures follow the company’s ESG reporting scope, but they help explain why energy management is an important component of its cost system: sustained reductions in unit consumption directly affect a paper machine’s ability to withstand low-price competition.
The energy recovery of solid waste deserves particular attention. A 1,000-metric-ton-per-day solid-waste incineration line at Chongqing Lee & Man commenced operation in 2024. The annual report states that in 2025 it generated 116.418 million kWh of electricity and produced 1.039 million metric tons of high-pressure steam, while reducing raw-coal consumption by 44,900 metric tons and solid-waste discharge by 128,700 metric tons. These are disclosed annual operating results, not project-planning figures.
The comprehensive waste-to-energy projects at the Guangdong and Malaysia production bases disclosed investments of RMB 350 million and RMB 300 million, respectively, together with their designed benefits. They convert waste residue, waste plastics, pulp rejects, sludge, and biogas into steam and electricity, theoretically reducing both purchased-energy requirements and end-of-pipe disposal pressure. Project economics must still account for investment, depreciation, operations and maintenance, emissions control, and fluctuations in feedstock heating value.
Lee & Man Paper’s energy advantage does not mean that “environmental protection has no cost.” Rather, through combined heat and power, solid-waste energy recovery, energy-efficiency upgrades, and process control, it seeks to convert previously fragmented energy-procurement, waste-disposal, and compliance expenses into system costs that are more manageable and, where possible, recoverable.
04 · SUPPLY RADIUS
Layer Four: Eight Production Bases Are Not a Scale Collage, but a Supply-Radius Design
Packaging paper has relatively modest value per unit, is bulky, and is highly sensitive to transportation distance; logistics for both raw materials and finished products therefore materially affect delivered cost and customer responsiveness. Lee & Man Paper’s annual report lists eight production bases—Dongguan, Jiangsu, Guangdong, Chongqing, Jiangxi, Vietnam, Malaysia, and Chongzuo in Guangxi—forming an interconnected manufacturing network across South China, East China, Southwest China, Central China, and Southeast Asia.
The domestic production bases are close to packaging consumption, corrugated-box converting, and manufacturing customers in China; Chongqing, Jiangxi, and Guangxi also provide different support points for pulp, tissue paper, and regional markets. The Vietnam and Malaysia bases together list approximately 1.95 million metric tons of annual paper and paper-products capacity, enabling Lee & Man Paper to serve Southeast Asia from more than its Chinese factories and providing a second supply radius under different raw-material, trade, and market environments.
In 2025, approximately 84% of Lee & Man Paper’s revenue came from external customers in China, compared with approximately 89% in the prior year; the remainder came mainly from customers in Malaysia and Vietnam. The rising share of overseas revenue signals that regional production bases are beginning to translate into a market structure, but it also introduces management complexity involving cross-border procurement, foreign exchange, quality consistency, production-sales coordination, and local policy.
More production bases do not automatically make a company stronger. The key to network capability is whether every base can secure suitable raw materials, maintain stable operating rates, reach economically viable customers, and reduce duplicate inventories and cross-regional backhauls. A production-base network forms a genuine cost moat only when gains in market responsiveness and logistics exceed organizational complexity.
The Metrics That Truly Define a Network
Evaluating a production-base layout requires more than counting factories and capacity. It also requires examining delivered raw-material costs, finished-product distribution radius, regional production-to-sales ratios, inter-base transfers, customer delivery cycles, and return on invested capital at each base.
05 · PROFIT MIX
Layer Five: Packaging Paper Is the Foundation, While Tissue Paper Is Reshaping the Profit Mix
In 2025, packaging paper contributed 75.7% of Lee & Man Paper’s external revenue and remained its absolute core. Tissue-paper revenue was HK$6.017 billion, up 15.1% year over year, representing 22.6% of external revenue; external wood-pulp revenue accounted for approximately 1.7%. By revenue structure, Lee & Man Paper remains a company built on packaging grades such as linerboard and corrugating medium.
The profit structure, however, is no longer identical to the revenue structure. Tissue-paper segment profit reached HK$1.063 billion, up 12.9% year over year and representing approximately 43.7% of aggregate profit across the three segments, based on annual-report data; packaging paper accounted for approximately 52.2%. Tissue paper generated more than 40% of segment profit on less than one-quarter of revenue, showing that it is no longer a peripheral business but an important pillar of Lee & Man Paper’s profit portfolio.
Tissue paper has different demand patterns, brand channels, and price-formation mechanisms from industrial packaging paper and can reduce exposure to a single packaging-paper cycle. Packaging paper provides the foundation for scale manufacturing, customer networks, and cash turnover, while wood pulp supplies fiber internally. Together, the three form a portfolio combining “industrial-product scale + consumer-product value + upstream raw materials.”
A portfolio does not provide an automatic hedge. In 2025, tissue-paper segment profit grew more slowly than revenue. Based on annual-report data, segment profit as a percentage of external revenue edged down from approximately 18.01% to 17.66%. Consumer businesses must also bear the requirements of branding, channels, promotion, finished-goods inventory, and quality consistency, so long-term competitiveness cannot be explained by capacity expansion alone.
The advantage of Lee & Man Paper’s product structure is not that “more businesses are always safer,” but whether different businesses can share pulp, energy, manufacturing, and supply-chain capabilities while preserving their own customer value and returns on capital.
06 · CAPITAL DISCIPLINE
Layer Six: Technical Upgrades and Capital Discipline Must Generate Higher Returns from Every Metric Ton
Public filing and environmental-assessment information in 2026 indicates that Guangdong Lee & Man plans to invest RMB 720 million in an in-situ technical upgrade of its PM7 line, with a filing-period construction schedule from June 2026 to June 2027. According to an industry summary of publicly available environmental-impact-assessment application materials, capacity would remain at 300,000 metric tons per year before and after the upgrade, while the proposed basis-weight range would shift from 120–250 g/m² to 60–160 g/m². The project would also upgrade systems including machine width, operating speed, stock screening, the headbox, and film-transfer sizing. These items are project plans, not realized upgrade results.
The most important feature of this kind of project is that “capacity remains unchanged.” Rather than pursuing growth through additional nominal tonnage, it seeks to improve product fit and asset output per metric ton through lower basis weight, higher quality, greater efficiency, and lower energy consumption. If customers can reduce packaging-paper basis weight while meeting compression-strength, burst-strength, ring-crush, and converting requirements, value may shift from “price per metric ton” to “material cost and performance per box.”
The capital position also improved. In 2025, Lee & Man Paper’s total finance costs, including capitalized amounts, declined from HK$935 million to HK$736 million; bank borrowings fell from HK$21.982 billion to HK$21.006 billion; the net gearing ratio, as defined in the annual report, decreased from 0.73 to 0.63; and net cash generated from operating activities rose from HK$426 million to HK$3.520 billion.
Cash-flow improvement cannot be assessed from one headline figure alone. In 2025, operating cash flow before changes in working capital was HK$2.673 billion, up approximately 24.8% year over year. Final operating cash flow was also supported by a HK$952 million decrease in inventories, a HK$162 million decrease in receivables and prepayments, and a HK$674 million increase in accounts payable as presented in the cash-flow statement. Collections improved, with trade-receivable turnover days shortening from 47 to 41 days.
One distinction is particularly important: the “HK$952 million decrease in inventories” shown in the cash-flow statement cannot be interpreted directly as a decline in the period-end inventory balance; inventory on the balance sheet actually increased from HK$4.419 billion to HK$4.822 billion. Public financial statements do not fully disaggregate the bridging factors between the two measures. At the same time, raw-material and finished-goods inventory turnover days increased from 54 and 14 days to 60 and 18 days, respectively, while accounts-payable turnover days extended from 43 to 61 days. This indicates that part of the cash-flow improvement coincided with slower inventory turnover and longer supplier payment terms.
Together, these figures support a more complete judgment:
Lee & Man Paper’s profitability, debt position, and cash position are improving, but raw-material and finished-goods inventory efficiency, supplier payment terms, and returns from technical upgrades still require continued observation. Genuine capital discipline means simultaneous improvement in margins, inventory, payables, debt, and free cash flow—not reliance on any single indicator.
2026 CHANGE SIGNALS
Six Recent Developments Are Redefining Lee & Man Paper’s Cost Boundaries
March 2026 | Profit Recovery Confirmed by the Annual Report
2025 revenue increased 2.5%, while profit attributable to ordinary shareholders rose 47.9% (profit for the year increased 43.0%). The packaging-paper segment significantly restored profit while revenue remained broadly flat, indicating at a minimum that the operating improvement cannot be explained by scale expansion alone. The contribution of individual factors still requires more granular volume, price, and cost data.
March–July 2026 | PM7 Shifts from “More Tons” to “Better Tons”
The RMB 720 million technical upgrade would keep annual capacity unchanged at 300,000 metric tons while shifting toward lower-basis-weight, high-grade kraft linerboard and upgrading stock preparation, papermaking, and automatic-control systems. The project is currently at the filing and public environmental-assessment stage and cannot be described in advance as completed.
2026 Operating Direction | Automation and Artificial Intelligence Enter Manufacturing Processes
In its annual report, the company states that it will actively deploy automation, artificial intelligence, and other technologies to optimize production processes and workflows and advance power-station technology upgrades. This shows that smart manufacturing has entered its cost-reduction framework, but quantified results in cycle time, energy consumption, quality, and labor efficiency are still needed.
May–June 2026 | Guigang Project Enters Equipment Installation
Public information from Guigang indicates that the “Guigang Lee & Man Paper Project” has planned total investment of RMB 27.5 billion. Phase I has planned investment of RMB 10 billion for 1 million metric tons of bleached chemical pulp and 800,000 metric tons of high-grade tissue paper and related products; Phase II has planned investment of RMB 17.5 billion for bio-based, biodegradable high-end new materials. Equipment installation for Phase I began in May, with production expected in mid-2027. The project is not among the eight production bases listed in Lee & Man Paper’s 2025 annual report, so this article does not include the planned capacity in the listed company’s existing capacity. Formal disclosure is still needed to confirm how the project’s investment, assets, and earnings would be included in the listed company’s consolidated reporting scope.
July 2026 | Marginal Profit Continues to Rise in the First Half
The positive profit alert forecasts a 64% to 71% year-over-year increase in first-half profit, explicitly attributing the increase to higher marginal profit. The company announced that its board would meet on August 3 to consider the interim results; as of this article’s verification date of August 9, no formal results announcement had been found. Subsequent results must establish whether the improvement came from selling prices, raw materials, product mix, output, expenses, or a combination of factors.
2026–2028 | Overseas Sales Interfaces Become More Institutionalized
A continuing connected-transaction announcement sets annual caps under the packaging-paper agreement for 2026, 2027, and 2028 at HK$279.8 million, HK$542.3 million, and HK$569.4 million, respectively. Transactions will be conducted through individual orders, and neither party is subject to an exclusive-dealing obligation. The annual caps are not secured orders, sales commitments, or revenue forecasts. Their value lies in providing an institutionalized interface for overseas sales and leveraging the cost and location advantages of the Malaysia and Vietnam production bases—not in recognizing revenue in advance.
CONCLUSION
Cost Optimization Is the Objective;
System-Level Control Is the Capability
Lee & Man Paper’s true strength does not lie in having a permanently fixed lowest cost, but in breaking cost into manageable variables: how fiber is selected, where pulp comes from, how energy is recovered, how far production bases reach, how products are combined, how paper machines are upgraded, and how capital turns over.
When these variables work together, a modest change in revenue can release much greater profit elasticity. When one link becomes unbalanced, the operating load of pulp mills, energy facilities, overseas production bases, tissue-paper channels, and inventory capital can simultaneously amplify complexity. This is the real boundary where “system advantage” and “heavy-asset risk” coexist.
Five questions will determine whether Lee & Man Paper can continue to strengthen:
Will the 2026 interim profit forecast translate into simultaneous improvements in sales volume, profit per metric ton of paper, and operating cash flow?
Can the PM7 upgrade achieve its quality-consistency, customer-qualification, and energy-consumption targets for lower-basis-weight products?
Can tissue paper maintain its high profit contribution without erosion from channel expenses and inventory?
Can the overseas production bases and the Guigang-related project generate clear market, capital, and consolidated-reporting returns?
As debt declines, can raw-material inventory, finished-goods inventory, and supplier payment terms return together to more favorable levels?
Lee & Man Paper’s deepest competitiveness lies in turning “cheap” into an engineering system, cost into controllable variables, and controllable cost into profit resilience and market optionality.
NEXT ISSUE · Series Preview
Next: Why Is Shanying International Strong? It Actually Operates a Circular Network
“China Paper Leaders Case Study Series” goes beyond basic company profiles to continuously analyze the resource, cost, product, management, and industrial-chain capabilities of leading paper companies.
BIOTEN Packaging · Industry Insights · Research Notes
China Paper Association, 2025 Annual Report on China’s Paper Industry: Industry Operations and Key Enterprise Information
Lee & Man Paper 2025 Annual Report: Original HKEX Disclosure
Lee & Man Paper 2026 Interim Positive Profit Alert: Original HKEX Disclosure
Lee & Man Paper Notice of Board Meeting for the 2026 Interim Results: Original HKEX Disclosure
Lee & Man Paper Production Bases and Capacity Layout: Company Website
Guangdong Lee & Man PM7 Production-Line Technical-Upgrade Filing: Summary from the Guangdong Online Investment Project Approval and Supervision Platform
Public-Participation Notice for the Guangdong Lee & Man PM7 Environmental Impact Report: Technical Summary from the Original Page of the Dongguan Environmental Protection Industry Association
Construction Progress of the Guigang Lee & Man Paper Project: Guigang Daily · Guigang News Network
2026–2028 Packaging-Paper Agreement: Original HKEX Disclosure
This article is provided for industry research and general informational purposes only and does not constitute investment, business, or legal advice. Its analysis of corporate strategy, competitiveness, and industry opportunities contains professional judgments based on publicly available information, does not represent official statements by the company, and does not imply any cooperation or product-adoption relationship. 2025 data are from the audited annual report; the 2026 interim profit forecast consists of preliminary unaudited data. Designed capacity, planned investment, filing, environmental assessment, equipment installation, and expected commissioning dates do not equal actual output, effective capacity, completed commissioning, or commercial returns. The Guigang project is a locally disclosed project development and is not among the eight production bases listed in Lee & Man Paper’s 2025 annual report. Available public information is insufficient to confirm how all of its investment, assets, and earnings would be included in the consolidated reporting scope of the Hong Kong-listed company. Companies should conduct further verification based on formal announcements, project approvals, actual commissioning, and specific application requirements. Information verified through August 9, 2026.