
造纸经营观察 · 2026年中报
利润增了,修复为何不同步
国家统计总盘回升,16份中报样本却走出不同曲线。关键不在纸价涨跌本身,而在净价、成本、开机、固定负担和现金能否连续改善。
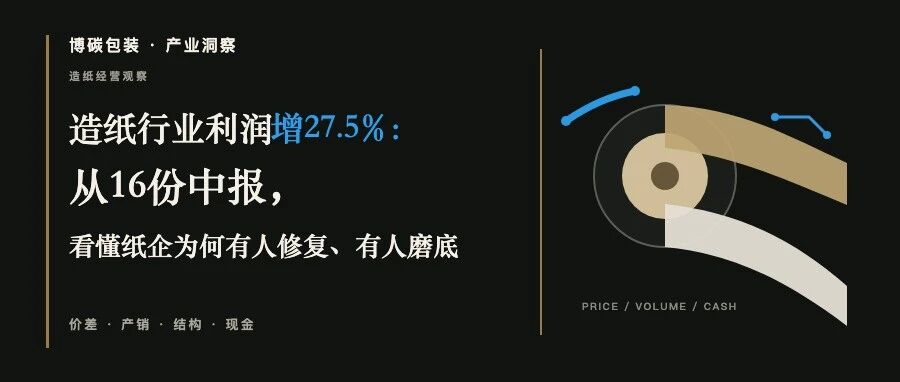
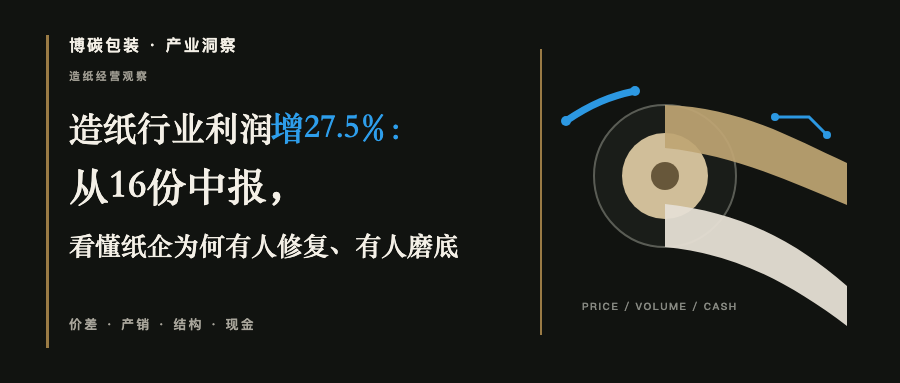
行业利润增长27.5%,更多是一项总量修复信号。企业要完成修复,必须让价差、产销和现金连续改善;少一环,利润都可能停在纸面上。
太阳纸业箱板纸收入增长35.54%,铜版纸下降29.65%;山鹰半年亏损6.82亿元却有16.44亿元经营现金流,荣晟盈利1.90亿元但经营现金流为负。纸种、利润与现金正在走不同的线。
16份中报是按截至2026年8月25日晚披露时点及主营业务可比性重建的固定样本;全国行业统计、公司合并报表和分产品数据分别使用。
行业总盘|2026年上半年
6897.9亿元|+5.5% 规上造纸和纸制品业营业收入。
6077.3亿元|+5.2% 营业成本,增速略低于收入。
196.1亿元|+27.5% 利润总额,增速明显高于收入。
约2.84% 本文按累计利润总额/营业收入简单计算的辅助比值。
最新更新:1—7月收入8050.5亿元、成本7097.7亿元、利润227.5亿元,利润同比增长27.6%,简单比值约2.83%。两项比值均不是国家统计局单独发布的造纸行业利润率。
研究资料:国家统计局上半年规上工业利润;1—7月规上工业利润。
本文16份中报样本中,10家公司归母净利润改善或扭亏,6家恶化;14家扣非净利润为正,13家经营现金流为正。总盘回升已经具备一定广度,但远未形成同样质量的利润和现金。
样本为太阳、景兴、齐峰、恒达、青山、民丰、华泰、恒丰、冠豪、山鹰、荣晟、林平、五洲、森林、华大海天和民士达;企业横跨多个纸种与业务,不按单一标签评价。
01 · 同公司验证
太阳纸业:同企两条线
太阳纸业上半年营业收入208.62亿元,同比增长9.15%;归母净利润19.51亿元,同比增长9.60%;经营现金流33.66亿元,同比增长77.74%。集团总表平稳,分产品数据却明显分叉。
同一主体,三种传导
牛皮箱板纸 收入70.76亿元,同比增长35.54%;毛利率18.48%,提高2.84个百分点。
双胶纸 收入下降4.86%;毛利率10.80%,下降3.58个百分点。
铜版纸 收入下降29.65%;毛利率8.89%,下降7.96个百分点。
同一主体、同一报告期排除了大部分跨公司噪音。不同纸种面对不同的需求、供给和定价节奏,原料与制造能力必须经过产品结构,才会进入利润表。
多基地、浆纸一体化和产品组合提供了对冲空间,却不等于全面景气。太阳纸业整体浆及纸制品毛利率仍下降1.17个百分点。综合企业能调度更多资源,最终仍要用分纸种毛利和经营现金检验。
研究资料:太阳纸业2026年半年度报告。
02 · 包装纸
包装纸修复,看价差与产销
景兴纸业|产品、费用与营运资金共同改善
营业收入31.61亿元,同比增长20.22%;归母净利润1.39亿元,同比增长152.95%;经营现金流由净流出4.91亿元转为净流入6.01亿元。工业原纸和再生浆板收入增长;可转债兑付后财务费用下降85.34%,销售增加与存货减少也改善了现金。
五洲特纸|产能贡献与资本投入同时出现
营业收入48.95亿元,同比增长18.76%;归母净利润2.30亿元,同比增长88.95%。废纸系产品收入增长49.48%,均价上涨9.46%;木浆系产品均价下降3.60%。湖北工业包装纸产线全面投产,是营收新增量之一。
与此同时,公司投资活动现金净流出13.59亿元,筹资活动现金净流入13.41亿元。新增产能已经贡献销量和利润,后续仍需用利用率、单位成本、订单覆盖与现金回报检验。
山鹰国际|量价修复仍需覆盖固定负担
造纸销量增长7.68%,二季度归母亏损较一季度减少3.13亿元,环比减亏62.95%,6月实现单月扭亏;但上半年归母仍亏损6.82亿元。营业成本增长8.65%,快于收入;财务费用虽同比下降8.65%,金额仍为4.11亿元。
包装纸先修复,指的是部分企业的量价、开工和季度毛利开始改善。若成本继续上行,或者新增产能快于订单恢复,销量增长仍可能留不下足够利润。
研究资料:景兴纸业半年报;五洲特纸半年报;山鹰国际半年报。
03 · 文化纸
文化纸磨底,木浆不是答案
文化纸压力已经出现在太阳纸业双胶纸和铜版纸分项。华泰股份又给出一组公司样本:营业收入62.11亿元,同比下降3.10%;归母净利润1889万元,同比下降72.07%;扣非净利润亏损198万元,经营现金流净流出6989万元。
木浆价格下降可以减轻成本,却不能单独决定利润。成纸售价如果下降得更快,单吨价差仍会收窄;需求恢复、同质化供给、新增产能和库存,又会影响价格企稳的时间。华泰同时经营造纸和化工业务,其合并数据不能被解释为纯文化纸损益。
“磨底”不是长期标签。若成纸净价企稳、供给收缩,或者企业通过自产浆、差异化产品、出口和费用控制形成新价差,两条利润线就可能重新靠拢。需要确认的不是一份提价函,而是净成交价、订单、库存与现金是否同步改善。
研究资料:太阳纸业半年报;华泰股份半年报。
04 · 利润质量
利润与现金,可能反向
恒达新材营业收入5.48亿元、归母净利润5385万元,分别增长5.16%和57.29%;医疗与食品包装原纸占营业收入88.10%。细分应用和产品结构支撑了改善。
但归母净利润不能单独代表主业成色。冠豪高新归母净利润2.13亿元,扣非净利润0.32亿元,两者相差约1.81亿元。森林包装收入增长74.51%至20.25亿元,归母净利润却下降73.68%至819万元。公司称收入增长主要来自造纸产能增加;利润下降的主要因素包括增值税即征即退减少2481.84万元,以及60万吨数码喷墨纸项目仍未盈利。
利润和现金还可能交叉:山鹰归母亏损6.82亿元,经营现金流净流入16.44亿元;公司称主要由于销售回款增加。荣晟归母净利润1.90亿元、扣非净利润1.06亿元,经营现金流却净流出5752万元。
归母净利润判断股东层面结果,扣非净利润观察持续经营成色,经营现金流检查利润是否回款。现金还应继续拆解应收、存货、应付和票据变化,正现金不自动等于主业已经全面修复。
研究资料:恒达新材半年报;冠豪高新半年报;森林包装半年报;山鹰国际半年报;荣晟环保半年报。
同一轮行业修复,先走出来的不是某一种纸,而是那些能让价差、产销和现金同时改善的企业。
05 · 产业链判断
下半年,先盯四项
价差|实际净成交价是否跑赢废纸、木浆、能源、化学品与物流成本。
产销|订单、销量、开机率、库存和新增产能是否匹配;量增能否摊薄固定负担。
结构|利润来自高价值产品和持续经营改善,还是低基数、费用、税收与一次性因素。
现金|应收、存货、应付、票据、利息和资本开支有没有吞掉利润。
对纸厂,这四项应落实为分纸种利润桥和产能爬坡表;对纸板纸箱与印刷包装企业,应落实为实际采购价、终端订单、库存和客户调价接受度;对设备、化学品和纤维供应商,则要落实为客户开机、技改回报、良率、采购持续性与项目现金回收。
纸上谈兵·数说本质
行业利润增长27.5%,证明造纸和纸制品业正在走出低位,却不能证明16份中报样本已经同步复苏。包装纸先改善了部分企业的价差和产销;文化纸仍在等待更稳定的净价与供需关系;特种纸继续按应用壁垒、产能阶段和利润质量分化。
已经形成的是行业利润回升;正在释放的是部分企业的产品结构和经营效率;尚待兑现的是这些改善能否穿过库存、应收、利息与资本开支,持续变成现金和下一轮竞争力。
博碳包装关注纸张性能、加工效率和终端应用之间的价值能否真正打通。产业链不必简单押注某一种纸,更应识别哪一种能力已经形成、哪一笔利润可以持续、哪一段现金仍需要等待。
博碳包装·产业洞察·研究说明
本文依据国家统计局、16家上市公司2026年半年度报告及公开行业资料,由博碳包装独立研究整理,全国行业统计、公司合并数据和分产品数据分别使用。本文仅供造纸与包装产业链研究学习,不构成投资、采购、定价或交易依据;如对内容、数据或权益有意见,可提出修改、说明或删除要求,博碳包装将在收到后24小时内核查处理。
博碳观察数据与核验来源
01|国家统计局|2026年1—6月份全国规模以上工业企业利润
02|国家统计局|2026年1—7月份全国规模以上工业企业利润
03|证券日报|A股上市纸企中期业绩分化
04|太阳纸业|2026年半年度报告
05|景兴纸业|2026年半年度报告
06|五洲特纸|2026年半年度报告
07|山鹰国际|2026年半年度报告
08|华泰股份|2026年半年度报告
09|恒达新材|2026年半年度报告
10|冠豪高新|2026年半年度报告
11|荣晟环保|2026年半年度报告
12|森林包装|2026年半年度报告
Papermaking Operations Review · H1 2026
Industry profits are rising—why is recovery uneven?
Industry-wide statistics show an upswing, yet the 16-company interim-report sample follows sharply different trajectories. The key is not the direction of paper prices alone, but whether net realized prices, costs, operating rates, fixed-cost absorption, and cash generation can improve in sequence.
The industry’s 27.5% profit growth is primarily an aggregate recovery signal. For an individual company to complete the recovery, margins, production and sales, and cash generation must improve consecutively; if any link is missing, the profit may remain only on paper.
Sun Paper’s kraft linerboard revenue rose 35.54%, while coated art paper revenue fell 29.65%; Shanying International recorded an H1 loss of RMB 682 million but RMB 1.644 billion of operating cash flow, while Rongsheng Environmental Protection earned RMB 190 million yet reported negative operating cash flow. Paper grades, earnings, and cash are moving along different tracks.
The 16 interim reports form a fixed sample reconstructed from disclosures available as of the evening of 25 August 2026 and from the comparability of principal operations. National industry statistics, consolidated company statements, and product-level data are used on separate bases.
INDUSTRY OVERVIEW | H1 2026
RMB 689.79 billion | +5.5% Operating revenue of above-designated-size enterprises in the paper and paper products industry.
RMB 607.73 billion | +5.2% Operating costs, growing slightly more slowly than revenue.
RMB 19.61 billion | +27.5% Total profits, growing markedly faster than revenue.
Approx. 2.84% A supplementary ratio calculated in this article as cumulative total profits divided by operating revenue.
Latest update:For January–July, revenue was RMB 805.05 billion, costs were RMB 709.77 billion, and profits were RMB 22.75 billion; profits rose 27.6% year on year, giving a simple ratio of approximately 2.83%. Neither ratio is an official profit margin separately published by the National Bureau of Statistics for the paper industry.
Research sources:National Bureau of Statistics data on profits of above-designated-size industrial enterprises for H1 and January–July.
Within the 16-company interim-report sample, net profit attributable to shareholders of the parent improved or turned positive at 10 companies and deteriorated at six; adjusted attributable net profit was positive at 14 companies, and operating cash flow was positive at 13. The industry-wide upturn has gained some breadth, but it has not produced earnings and cash of comparable quality across companies.
The sample comprises Sun Paper, Jingxing Paper, Qifeng New Material, Hengda New Material, Qingshan Paper, Minfeng Special Paper, Huatai Paper, Hengfeng Paper, Guanhao High-Tech, Shanying International, Rongsheng Environmental Protection, Linping Paper, Wuzhou Special Paper, Forest Packaging, Huada Haitian, and Metastar. These companies span multiple paper grades and businesses and are not assessed under a single label.
SECTION 01 · WITHIN-COMPANY VALIDATION
Sun Paper: Two lines within one company
In H1, Sun Paper recorded operating revenue of RMB 20.862 billion, up 9.15% year on year; net profit attributable to shareholders of the parent of RMB 1.951 billion, up 9.60%; and net cash generated from operating activities of RMB 3.366 billion, up 77.74%. The consolidated figures were steady, but the product-level data diverged sharply.
One company, three transmission paths
Kraft linerboard Revenue of RMB 7.076 billion, up 35.54% year on year; gross margin of 18.48%, up 2.84 percentage points.
Uncoated woodfree paper Revenue down 4.86%; gross margin 10.80%, down 3.58 percentage points.
Coated art paper Revenue down 29.65%; gross margin 8.89%, down 7.96 percentage points.
Using one company and one reporting period removes most cross-company noise. Different paper grades face different demand, supply, and pricing cycles; raw-material and manufacturing capabilities must pass through product mix before reaching the income statement.
Multiple production bases, pulp–paper integration, and a diversified product portfolio provide room for internal hedging, but they do not imply a broad-based upcycle. Sun Paper’s overall gross margin for pulp and paper products still declined by 1.17 percentage points. An integrated producer can allocate more resources, but performance must ultimately be tested through gross margin by paper grade and operating cash generation.
Research sources:Sun Paper H1 2026 Interim Report.
SECTION 02 · PACKAGING PAPER
Packaging-paper recovery depends on margins, production, and sales
Jingxing Paper | Products, expenses, and working capital improve together
Operating revenue was RMB 3.161 billion, up 20.22% year on year; net profit attributable to shareholders of the parent was RMB 139 million, up 152.95%; and operating cash flow shifted from a net outflow of RMB 491 million to a net inflow of RMB 601 million. Revenue from industrial base paper and recycled-pulp board increased. Finance costs fell 85.34% after redemption of the convertible bonds, while higher sales and lower inventories also improved cash generation.
Wuzhou Special Paper | Capacity contribution and capital investment appear together
Operating revenue was RMB 4.895 billion, up 18.76% year on year, and net profit attributable to shareholders of the parent was RMB 230 million, up 88.95%. Revenue from recovered-paper-based products increased by 49.48%, with average selling prices up 9.46%; average prices for wood-pulp-based products fell 3.60%. The full commissioning of the industrial packaging paper line in Hubei was one source of incremental revenue.
At the same time, net cash used in investing activities was RMB 1.359 billion, while net cash generated from financing activities was RMB 1.341 billion. New capacity has already contributed volume and profit, but utilization, unit costs, order coverage, and cash returns still need to be validated.
Shanying International | Volume and price recovery must still absorb the fixed-cost burden
Paper sales volume increased 7.68%. The attributable net loss in Q2 narrowed by RMB 313 million from Q1, a sequential reduction of 62.95%, and June returned to profit on a monthly basis; nevertheless, the attributable net loss for H1 remained RMB 682 million. Operating costs grew 8.65%, faster than revenue. Finance costs fell 8.65% year on year but remained RMB 411 million.
When packaging paper is described as recovering first, it means that volume, pricing, operating rates, and quarterly gross margins have begun to improve at some companies. If costs continue to rise or new capacity outpaces the recovery in orders, higher sales volume may still fail to generate sufficient profit.
Research sources:Jingxing Paper H1 2026 Interim Report; Wuzhou Special Paper H1 2026 Interim Report; Shanying International H1 2026 Interim Report.
SECTION 03 · PRINTING AND WRITING PAPER
Printing and writing paper is bottoming; lower pulp prices are not the answer
Pressure in printing and writing paper is already visible in Sun Paper’s uncoated woodfree and coated art paper segments. Huatai Paper provides another company-level sample: operating revenue was RMB 6.211 billion, down 3.10% year on year; net profit attributable to shareholders of the parent was RMB 18.89 million, down 72.07%; adjusted attributable net profit was a loss of RMB 1.98 million; and operating cash flow was a net outflow of RMB 69.89 million.
Lower wood-pulp prices can reduce costs, but they cannot determine profit on their own. If finished-paper prices fall faster, the spread per tonne will still narrow. Demand recovery, homogeneous supply, new capacity, and inventories also affect how quickly prices stabilize. Huatai operates both papermaking and chemical businesses, so its consolidated figures cannot be interpreted as the profit or loss of printing and writing paper alone.
“Bottoming” is not a permanent label. If net realized paper prices stabilize, supply contracts, or companies create new spreads through in-house pulp, differentiated products, exports, and cost control, the two earnings trajectories may converge again. The evidence required is not a single price-increase notice, but simultaneous improvement in net transaction prices, orders, inventories, and cash.
Research sources:Sun Paper H1 2026 Interim Report; Huatai Paper H1 2026 Interim Report.
SECTION 04 · EARNINGS QUALITY
Profit and cash can move in opposite directions
Hengda New Material recorded operating revenue of RMB 548 million and net profit attributable to shareholders of the parent of RMB 53.85 million, up 5.16% and 57.29%, respectively. Base paper for medical and food packaging accounted for 88.10% of operating revenue. End-use segmentation and product mix supported the improvement.
Attributable net profit alone, however, does not establish the quality of core operations. Guanhao High-Tech reported attributable net profit of RMB 213 million and adjusted attributable net profit of RMB 32 million, a gap of approximately RMB 181 million. Forest Packaging’s revenue rose 74.51% to RMB 2.025 billion, yet attributable net profit fell 73.68% to RMB 8.19 million. The company said revenue growth mainly reflected added papermaking capacity; major reasons for the profit decline included a RMB 24.8184 million reduction in VAT refunds under the refund-upon-collection policy and the fact that its 600,000-tonne-per-year digital inkjet paper project had not yet reached profitability.
Profit and cash can also cross: Shanying International posted an attributable net loss of RMB 682 million but a net operating cash inflow of RMB 1.644 billion, which the company attributed mainly to increased collection of sales proceeds. Rongsheng Environmental Protection reported attributable net profit of RMB 190 million and adjusted attributable net profit of RMB 106 million, but a net operating cash outflow of RMB 57.52 million.
Attributable net profit measures the result at shareholder level; adjusted attributable net profit indicates the quality of recurring operations; and operating cash flow tests whether earnings have been collected in cash. Cash should also be decomposed into changes in receivables, inventories, payables, and notes. Positive cash flow does not automatically mean that core operations have fully recovered.
Research sources:Hengda New Material H1 2026 Interim Report; Guanhao High-Tech H1 2026 Interim Report; Forest Packaging H1 2026 Interim Report; Shanying International H1 2026 Interim Report; Rongsheng Environmental Protection H1 2026 Interim Report.
In the same round of industry recovery, no single paper grade is necessarily first to emerge; the leaders are the companies able to improve margins, production and sales, and cash at the same time.
SECTION 05 · VALUE-CHAIN ASSESSMENT
Four indicators to watch in H2
Margins |Whether actual net realized prices outperform costs for recovered paper, wood pulp, energy, chemicals, and logistics.
Production and sales |Whether orders, sales volumes, operating rates, inventories, and new capacity are aligned—and whether volume growth can dilute the fixed-cost burden.
Product mix |Whether profit comes from high-value products and sustained operating improvement, or from a low base, expense changes, tax effects, and one-off factors.
Cash |Whether receivables, inventories, payables, notes, interest, and capital expenditure absorb the profit.
For paper mills, these four indicators should be translated into profit bridges by paper grade and capacity ramp-up schedules. For corrugated board, carton, and printed-packaging companies, they should become actual purchase prices, end-market orders, inventories, and customers’ acceptance of price adjustments. For equipment, chemical, and fiber suppliers, they should become customer operating rates, returns on technical upgrades, yield, purchasing continuity, and project cash recovery.
PAPER STRATEGY · THE FUNDAMENTALS IN THE DATA
The industry’s 27.5% profit growth shows that the paper and paper products industry is emerging from its low point, but it does not prove that all 16 companies in the interim-report sample are recovering in sync. Packaging paper has delivered earlier improvement in margins, production, and sales at some companies; printing and writing paper is still waiting for more stable net realized prices and a better supply–demand balance; specialty paper continues to diverge by application barrier, capacity stage, and earnings quality.
What has emerged is an industry-wide profit recovery. What is being released is the benefit of product mix and operating efficiency at selected companies. What remains to be demonstrated is whether these improvements can pass through inventories, receivables, interest, and capital expenditure to become sustained cash generation and the next round of competitiveness.
BIOTEN Packaging focuses on whether value is genuinely transmitted among paper performance, converting efficiency, and end use. The value chain need not bet simply on one paper grade; it should identify which capabilities are already established, which profits are sustainable, and which cash conversion still requires time.
BIOTEN PACKAGING · INDUSTRY INSIGHT · RESEARCH NOTE
This article was independently researched and prepared by BIOTEN Packaging using data from the National Bureau of Statistics, the H1 2026 interim reports of 16 listed companies, and other public industry sources. National industry statistics, consolidated company data, and product-level data are used on separate bases. This article is intended solely for research and learning across the paper and packaging value chain and does not constitute a basis for investment, procurement, pricing, or trading decisions. Requests for corrections, clarifications, or deletion concerning the content, data, or rights will be reviewed by BIOTEN Packaging within 24 hours of receipt.
BIOTEN OBSERVER · DATA AND VERIFICATION SOURCES
01 | National Bureau of Statistics | Profits of Above-Designated-Size Industrial Enterprises Nationwide, January–June 2026
02 | National Bureau of Statistics | Profits of Above-Designated-Size Industrial Enterprises Nationwide, January–July 2026
03 | Securities Daily | Diverging Interim Results among A-share Listed Paper Companies
04 | Sun Paper | H1 2026 Interim Report
05 | Jingxing Paper | H1 2026 Interim Report
06 | Wuzhou Special Paper | H1 2026 Interim Report
07 | Shanying International | H1 2026 Interim Report
08 | Huatai Paper | H1 2026 Interim Report
09 | Hengda New Material | H1 2026 Interim Report
10 | Guanhao High-Tech | H1 2026 Interim Report
11 | Rongsheng Environmental Protection | H1 2026 Interim Report
12 | Forest Packaging | H1 2026 Interim Report