














VALUE-CHAIN PROFIT WATCH
This analysis helps identify whether your profit is being constrained by quotations, order economics, inventory, collections or equipment utilisation.
Profit recovery has not passed through in sync, but do not immediately attribute it to margin pressure from paper mills: statistical classifications, pricing lags, order mix and working-capital use can put different segments of the same value chain on different rhythms.
The two growth rates from the National Bureau of Statistics of China indicate direction only. To find the answer for a specific company, separate the boundaries between C22 and C23, profit margins, PPI data and actual order economics.
Data for industrial enterprises above designated size provide an industry benchmark; disclosures by companies such as Zijiang Enterprise and Jingxing Paper serve only as mechanism-level examples. Company-level figures do not represent national average prices, and PPI is not a substitute for transaction prices for specific paper grades.
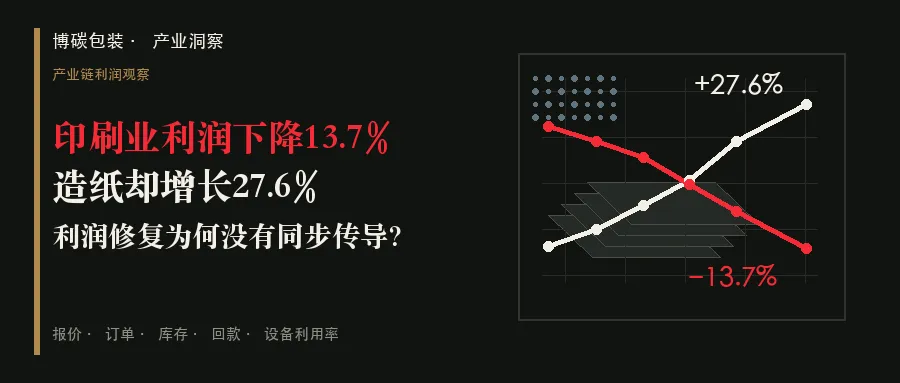
January–July 2026 | Industrial Enterprises Above Designated Size Nationwide
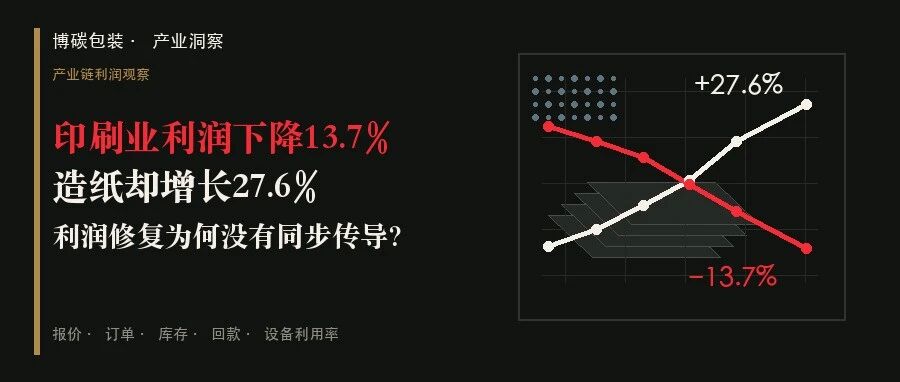
−13.7% Profit in Printing and Reproduction of Recorded Media · +27.6% Profit in Papermaking and Paper Products
SECTION 01 · START WITH CALIBRATION
Profit Growth Is Not the Same as Profit Margin
Using total profit divided by operating revenue as a simple estimate, the January–July 2026 profit margin was approximately 2.83% for papermaking and paper products and 4.06% for printing. Printing profit fell 13.7% year on year, yet its current margin remained about 1.23 percentage points higher.
The shift is in the trend: the estimated profit margin for papermaking rose from approximately 2.58% in the first half of 2025 to 2.84% in the first half of 2026; printing fell from approximately 4.86% to 4.03%. One improved by about 0.26 percentage points while the other contracted by roughly 0.82 percentage points.
2.83% | Papermaking and Paper Products
January–July 2026 cumulative data; estimated in this article as total profit divided by operating revenue.
4.06% | Printing
Still higher at present, but clearly weaker year on year.
4.22% | Implied Incremental Printing Margin for July
Derived by subtracting first-half cumulative figures from January–July cumulative figures; owing to cumulative reporting and rounding, this is an incremental observation only, not an officially published single-month margin.
Research sources: National Bureau of Statistics of China: Industrial Enterprise Profits, January–July; first-half 2026 data; first-half 2025 data
SECTION 02 · CLASSIFICATION AND PRICING
Industry Indices Cannot Directly Replace Company Quotations
C22 includes pulp and papermaking as well as the manufacture of paper and paperboard containers; C23 includes book and periodical printing, stationery printing, packaging and decorative printing, and other printing. Corrugated-container manufacturing and packaging printing are not in the same statistical division, so +27.6% and −13.7% do not form a neat upstream–downstream profit-allocation table.
In July 2026, the PPI for papermaking and paper products rose 0.9% month on month and 1.2% year on year; the printing sector fell 0.3% month on month and 3.0% year on year. On average from January to July, the two indices were still down 1.2% and 3.1%, respectively. Prices at the papermaking end showed marginal improvement, while printing remained under pressure.
Important boundary: PPI is not the transaction price of white paperboard, greyboard, containerboard or corrugating medium, still less the selling price of a particular customer's packaging SKU. Companies must compare like-for-like paper grades, basis weights, regions and contract periods.
Research sources: National Bureau of Statistics of China: July PPI; Industrial Classification for National Economic Activities
SECTION 03 · COMPANY EXAMPLES
One Company Can Have Multiple Pass-Through Curves
Zijiang Enterprise | Internal company data show that in the first half of 2026, the purchase price of white paperboard fell 8.2% year on year, greyboard rose 8.4%, and the unit selling price of colour-printed paper packaging fell 11.4%. The figures are unaudited and represent company-specific data only. Lower white-paperboard costs did not automatically translate into an equivalent margin gain because colour-printing prices fell faster, while greyboard moved in the opposite direction.
Jingxing Paper | The company reported that gross margin on base paper rose to 9.50%, while gross margin on corrugated cases and board fell to 5.10%. Operating cash flow moved from a net outflow of RMB 491.4 million to a net inflow of RMB 600.5 million, supported substantially by lower inventories and higher operating payables.
The two examples show that material costs, product selling prices, gross margins and cash can all move in different directions at the same time. Companies need to locate their own break in the pass-through chain, not label entire sectors as winners or losers.
Research sources: Zijiang Enterprise: Announcement of Key Operating Data; Jingxing Paper: Interim Report
SECTION 04 · OPERATING PATH
Profit Must Pass Through Five Gates from Cost to Cash
Base-paper costs first enter purchasing and then quotations. Once a quotation becomes an order, it must still pass through changeovers, waste, logistics and delivery. After revenue is recognised, value must pass through inventory, receivables and payment terms before returning as cash. Equipment utilisation then determines how much qualified output absorbs the fixed-cost base.
The five cards below do not answer the questions for a company; they convert them into fields that can be recorded, calculated, monitored and acted upon.
SECTION 05 · FIVE OPERATING CHECK CARDS
Trace Profit Bottlenecks to Specific Actions
CHECK CARD 01 | PRICE PASS-THROUGH
What to record | Paper grade, basis weight, region, supplier and unit purchase cost; corresponding customer, SKU, selling price and effective date of price adjustments.
How to compare | Pass-through days = effective date of the customer's new selling price − effective date of the new material cost. Calculate the pass-through rate only for the same SKU and period, and only when cost and selling price move in the same direction: pass-through rate = change in unit selling price ÷ change in unit material cost, with cost calculated from actual material consumption per item. If the directions differ or the denominator is zero, compare the unit spread and gross-margin change directly.
Warning signals | Costs rise while selling prices remain unchanged; when costs fall, selling prices fall faster.
Next step | Build paper-price linkage, repricing cycles and triggers for abnormal volatility into quotation rules.
CHECK CARD 02 | ORDER GROSS MARGIN
What to record | Materials, process steps, changeover time, waste, logistics, commissions, rebates and the cost of payment terms.
How to compare | Calculate the contribution margin for each order, then convert it into contribution per machine hour, per thousand impressions or per square metre, rather than relying on sales revenue alone.
Warning signals | Output rises while contribution per machine hour falls; small-batch, high-SKU work crowds out higher-contribution orders.
Next step | Adjust minimum order quantities, changeover charges, rush-order fees and approval authority for low-contribution orders.
CHECK CARD 03 | INVENTORY AND COLLECTIONS
What to record | Days of raw-material, work-in-process and finished-goods inventory; receivables ageing, payable terms and operating cash flow.
How to compare | Cash conversion cycle = inventory days + days sales outstanding − days payable outstanding; compare its direction with gross margin and net profit.
Warning signals | Profit rises while operating cash flow falls; inventories and overdue receivables increase together.
Next step | Review aged inventory, customer receivables ageing and order ownership weekly, and assign responsibility for stocking and overdue balances.
CHECK CARD 04 | PRODUCT MIX
What to record | Revenue, selling price, material mix, yield, gross margin, returns and complaints for corrugated transport packaging, folding cartons, food packaging, paper cups and paper bowls.
How to compare | Track both item-level gross margins and revenue weights, and calculate how mix changes affect the consolidated gross margin.
Warning signals | The share of high-revenue products rises while consolidated gross margin and cash decline.
Next step | Segment customers and SKUs into growth, recovery, maintenance and exit tiers, rather than applying one pricing strategy to every order.
CHECK CARD 05 | CAPACITY REALIZATION
What to record | Available machine hours, operating hours, qualified output, scrap, unit energy consumption, fixed costs and incremental depreciation.
How to compare | Operating rate = operating hours ÷ available machine hours; yield = qualified output ÷ input; fixed cost per unit = fixed costs ÷ qualified output.
Warning signals | Revenue from the new line rises, but operating rate remains low, yield is unstable and fixed cost per unit continues to increase.
Next step | Set separate thresholds for trial production, ramp-up, stable operation and positive cash contribution. Do not present design capacity as operating performance until the relevant gate has been passed.
SECTION 06 · STRESS TEST
What Evidence Would Change the Current Assessment?
If printing-sector PPI turns positive, orders and operating rates improve, inventories and receivables decline, yet profit margins continue to contract, the explanation of a squeeze from base-paper and other input costs gains weight. Conversely, if material costs fall but selling prices fall faster, or orders carry gross margin but cash remains weak, the problem extends beyond the upstream sector.
ON PAPER · THE NUMBERS REVEAL THE CORE
When recovery is out of sync along the same value chain, the underlying issue is that price, orders, production and cash have not completed their pass-through within the same cycle.
One question worth discussing internally: Where is your toughest bottleneck today: costs that cannot be passed into quotations, orders that generate no contribution margin, inventory and receivables tying up cash, or insufficient equipment utilisation?
BIOTEN Packaging · Industry Insights · Research Note
This article is based on data from the National Bureau of Statistics of China, industrial classification standards and official company disclosures. It was independently researched and compiled by BIOTEN Packaging and verified through 29 August 2026. It is intended solely for research and learning across the papermaking, paper-packaging and packaging-printing value chain and does not constitute securities, procurement or investment advice. No unauthorised customer, supply, pricing or project information was used. Requests for correction, clarification or removal concerning the content, data or rights will be reviewed within 24 hours of receipt.
BIOTEN Observer Data and Verification Sources
01 | National Bureau of Statistics of China | Profits of Industrial Enterprises Above Designated Size, January–July 2026
02 | National Bureau of Statistics of China | Industrial Enterprise Profits, First Half of 2026
03 | National Bureau of Statistics of China | Industrial Enterprise Profits, First Half of 2025
04 | National Bureau of Statistics of China | Producer Prices for Industrial Products, July 2026
05 | National Bureau of Statistics of China | Industrial Classification for National Economic Activities
06 | Zijiang Enterprise | Announcement of Key Operating Data for the First Half of 2026
07 | Jingxing Paper | 2026 Interim Report